
Table 2.
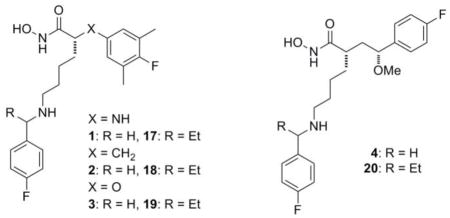
The in vitro potency, potential for toxicity, and PC properties for match pairs of LFIs representing each of the four core structures.
| |||||||||||||
|---|---|---|---|---|---|---|---|---|---|---|---|---|---|
| LFI | MW | Kia (nM) | CC50a (μM) | ClogPb | PSAc (Å2) | PAMPAd (log Pe) | MMP Ki (μM)a
|
CYP2D6a (μM) | hERGa (μM) | ||||
| −1 | −3 | −9 | −12 | −14 | |||||||||
| 1 | 391.2 | 0.24 | 61 | 3.7 | 92.6 | −5.9 | >50 | >50 | >50 | >50 | >50 | 1.35 | 1.23 |
| 17 | 419.2 | 0.17 | 32 | 4.6 | 88.1 | −5.1 | >50 | >50 | >50 | >50 | >50 | 0.24 | 0.95 |
| 2 | 390.2 | 0.13 | 16 | 4.0 | 88.9 | −4.8 | >50 | >50 | >50 | >50 | >50 | 0.02 | 4.65 |
| 18 | 418.2 | 0.31 | 15 | 4.8 | 74.6 | −4.1 | >50 | >50 | >50 | >50 | >50 | 0.08 | 13.3 |
| 3 | 392.2 | 1.20 | 26 | 3.8 | 86.9 | −5.2 | >50 | >50 | >50 | >50 | >50 | 0.23 | 0.79 |
| 19 | 420.2 | 1.00 | 21 | 4.7 | 83.9 | −4.4 | >50 | >50 | >50 | >50 | >50 | 0.34 | 2.7 |
| 4 | 406.2 | 0.58 | 55 | 3.2 | 81.9 | −5.8 | 33 | >50 | 21 | 2.3 | >50 | 1.26 | 2.0 |
| 20 | 434.3 | 0.27 | 35 | 4.0 | 80.1 | −5.1 | 47 | 31 | 11 | 12 | >50 | 0.16 | 10.0 |
a
see SI for experimental procedures; IC50 values given for CYP2D6 and hERG,
b
ClogP calculated with ChemDraw v12.0,
c
PSA calculated using PCModel v. 8.5,
d
PAMPA determined by the method of Wohnsland17 using Mllipore multiscreen 96-well plates