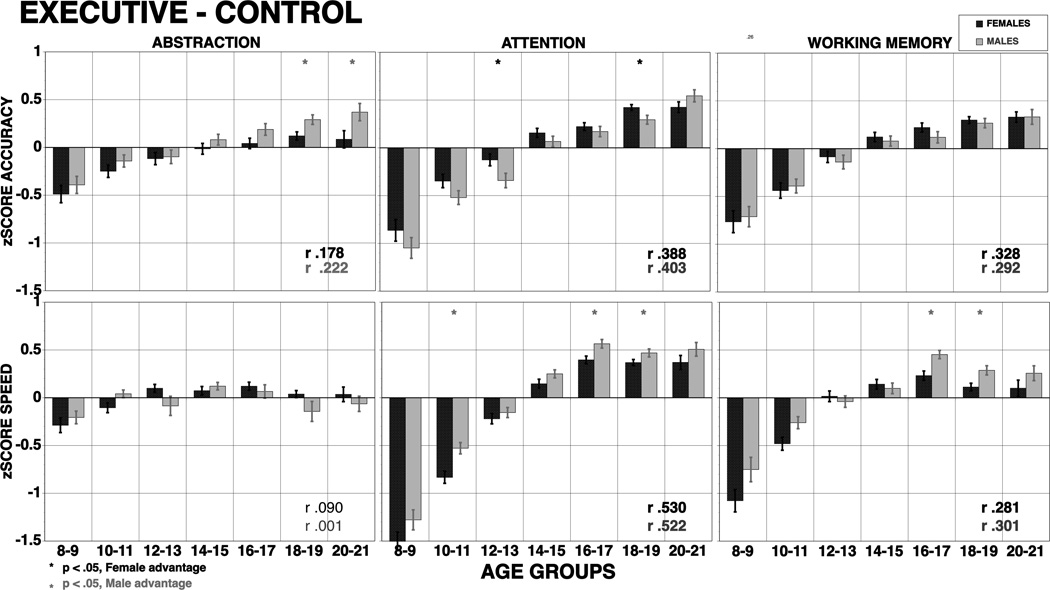
Figure 2.
Means (±SE) of z-scores for accuracy (top panel) and speed (bottom panel) for females (red bars) and males (blue bars) on executive-control functions. The results are shown by age groups and correlations with age are provided by sex (bold correlations are significant at p<.001). Stars indicate significant (p<.05) sex differences, red stars indicate better performance in females, blue stars better performance in males.

