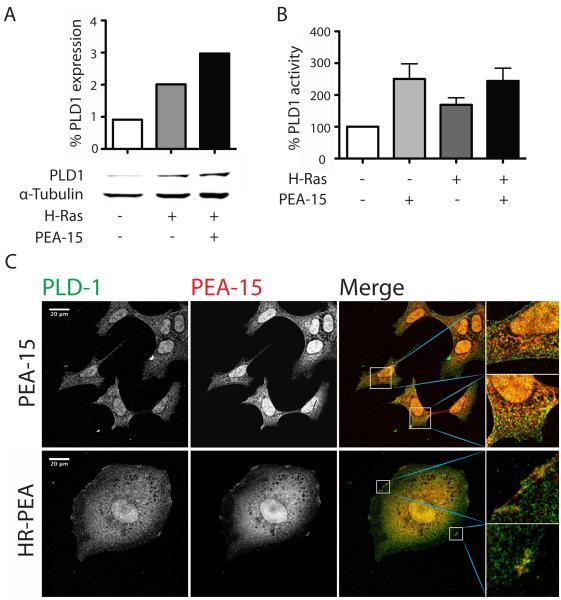
Figure 5.
PEA-15 increases expression and activity of PLD1 and co-localizes with it. (A) Western blot analysis of PLD1 expression in transiently transfected iBMK cells kept in suspension for 18h. Shown are Western blot (lower panel) and quantified expression levels normalized to α-tubulin. (B) PLD1 activity in transiently transfected iBMK cells after incubation in suspension for 18h. Shown is the percentage of PLD1 activity compared to control cells. (C) Immunofluorescence staining of stably transfected iBMK cells plated on fibronectin coated glass coverslips. Binding of specific primary antibodies against PLD-1 or PEA-15 was visualized using fluorescence labeled secondary antibodies (A488, green and Alexa647, red). Slides were analyzed using a Leica TCS-SP5 confocal microscope. White scale bars represent 20μm. Co-localization is shown in yellow.

