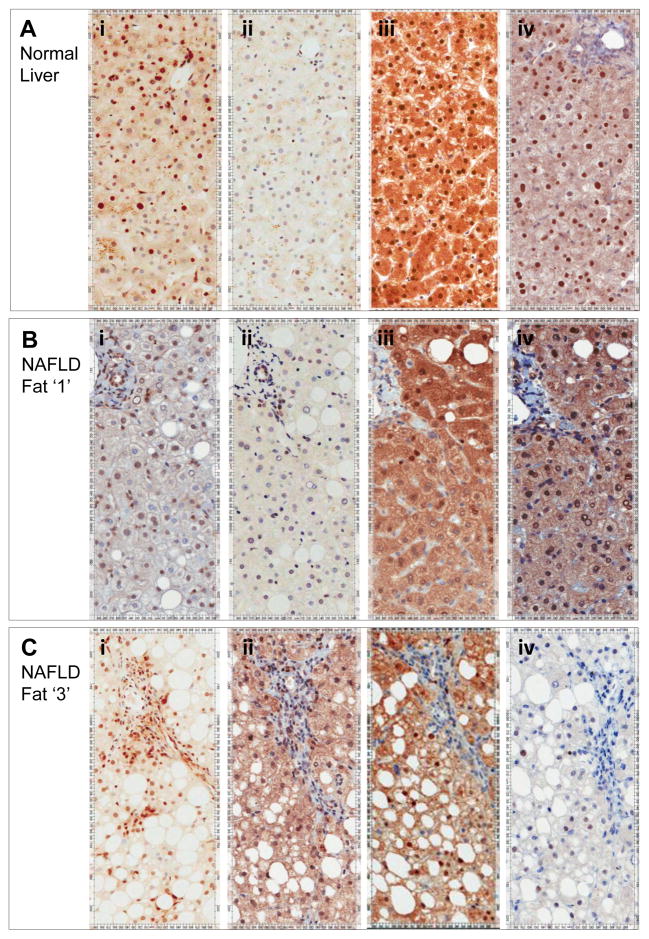
Figure 6. KLF6-FL falls in hepatocytes with advanced steatosis, but increases in inflammatory and sinusoidal cells.
KLF6 expression detected by the 1A9 monoclonal (all isoforms) is evident in hepatocytes and non-parenchymal cells in normal liver (Ai). A fall in hepatocytes in the presence of steatosis is contrary to an increase in inflammatory and sinusoidal cells (Bi+Ci). In contrast, KLF6-SV1 increases preferentially in hepatocytes in the presence of more advanced steatosis (Aii–Cii). These changes in representative sections parallel mRNA data in Figure 5, as do changes in GCK and GCKR. Both are present in normal liver (Aiii+iv), with notable nuclear localisation in this fasted state. The pattern is similar but less dramatic in the presence of fat grade 1 simple steatosis (Biii+iv). In the presence of more severe steatosis, expression of both is notably reduced (Ciii+iv). Quantification of nuclear expressions have been performed using imaging software and these additional data are included as Supplementary Figures.

