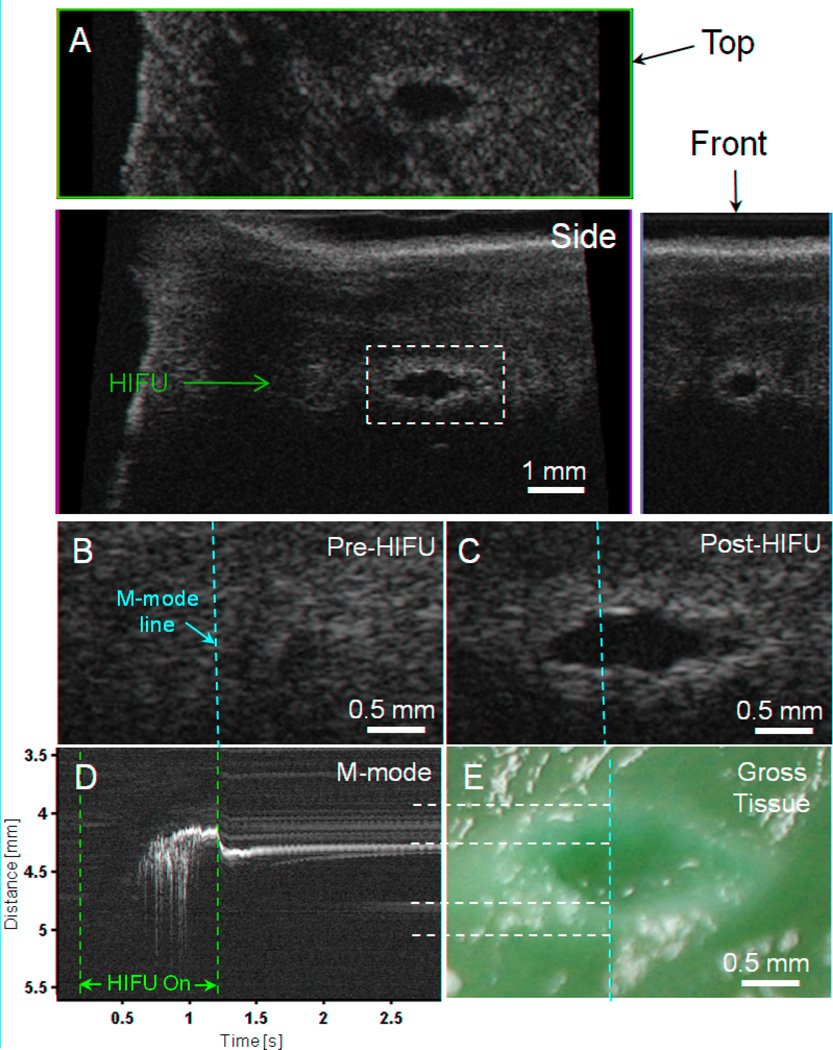
Figure 2.
High-resolution imaging (55 MHz) of HIFU lesion (6100 W/cm2, 1 kHz PRF, 50% duty cycle, 1 s exposure) with hyperechoic border and hypoechoic core. (A) B-mode image in plane of scanhead (side view) along with top and front C-mode images through the approximate center of the lesion. (B) B-mode images of the pre-HIFU area and (C) post-HIFU lesion with the location of M-mode line superimposed (dashed yellow). The dashed white line in Fig. 2A shows the location of these images relative to the larger specimen (D) M-mode image reconstructed from RF data before, during, and after HIFU treatment. The start (t = 0.2 s) and end (t = 1.2 s) of HIFU treatment is indicated by the dashed red lines. (E) Photograph of macroscopic tissue cross-section. The yellow vertical dashed line indicates the approximate location of the M-mode line, while the white horizontal lines show the correspondence between the M-mode and macroscopic lesion along the lesion and cavity boundaries.

