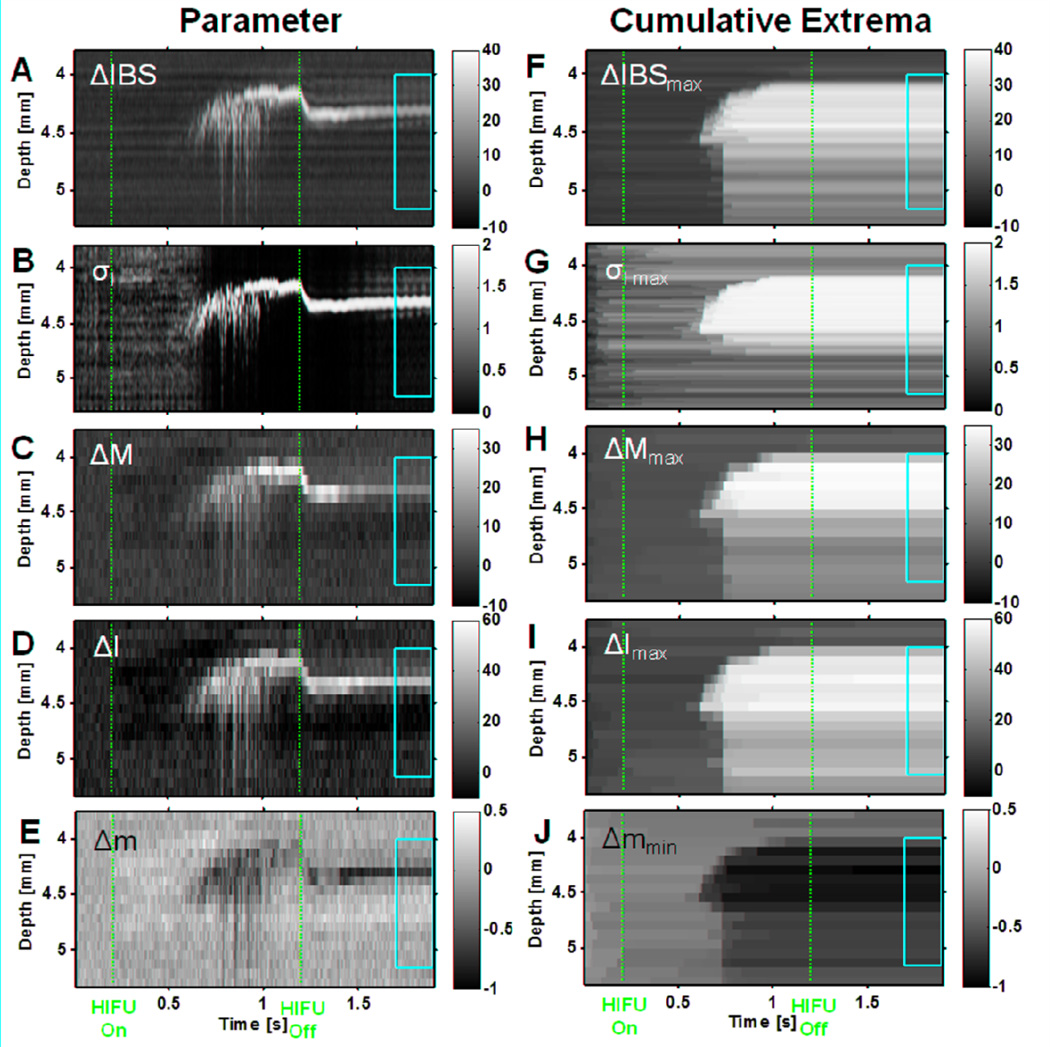
Figure 3.
Parametric M-mode images of HIFU lesion (6100 W/cm2, 1 kHz PRF, 50% duty cycle, 1 s exposure) based on RF data corresponding to specimen in Fig. 2. The left column shows the parameters (A) Integrated backscatter change ΔIBS(z,t) [dB], (B) Initial-line-to-current-line decorrelation σI(z,t), (C) Midband-fit change ΔM(z,t) [dB], (D) Intercept change ΔI(z,t) [dB], (E) Slope change Δm(z,t) [dB/MHz], while the right column shows the corresponding temporal extrema (defined in Eq. (11)) of these quantities (F) ΔIBS(z,t)max [dB], (G) σI(z,t)max, (H) ΔM(z,t)max [dB], (I) ΔI(z,t)max [dB], (J) Δm(z,t)min [dB/MHz]. The vertical dashed red lines indicate the times at which the HIFU treatment was turned on and off (t = 0.2 s and 1.2 s). The yellow box vertically delineates the estimated spatial region where the lesion was formed based on examination of the macroscopic lesion (Fig. 2E) and horizontally delineates the temporal duration from 0.5 s to 0.7 s after the HIFU was turned off where the tissue has reached a quasi-stable state.

