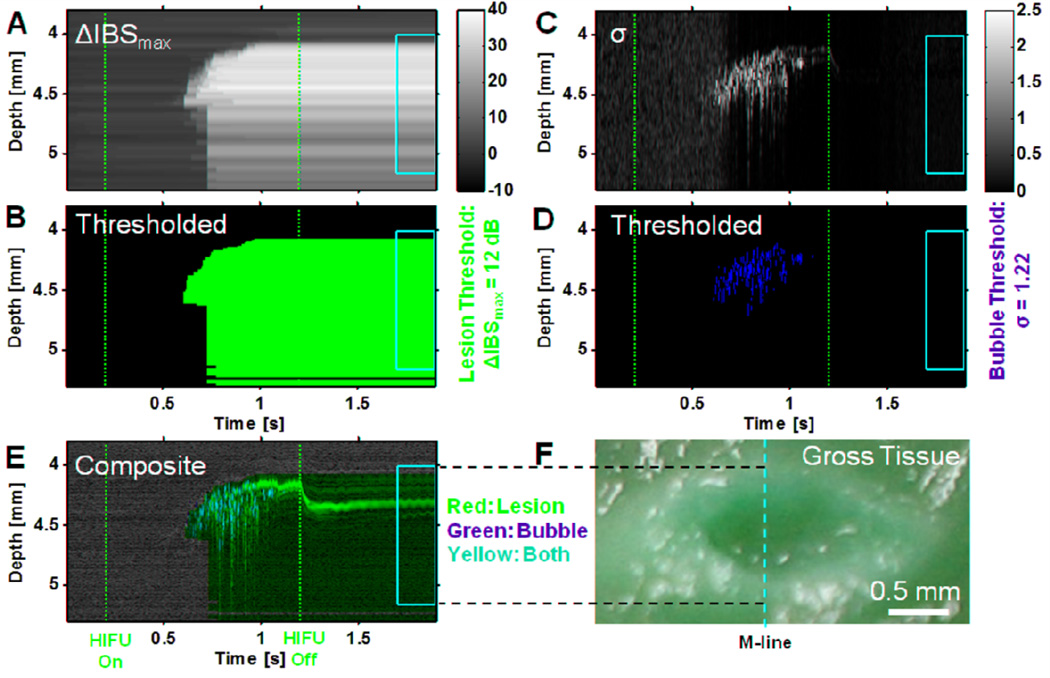
Figure 5.
Example implementation of lesion- and bubble-activity marking algorithms for data in Figs. 2–4 (6100 W/cm2, 1 kHz PRF, 50% duty cycle 1 s exposure). (A) Cumulative maximum change in integrated backscatter relative to initial state ΔIBS(z,t)max. The vertical dashed red lines indicate the times at which the HIFU treatment was turned on and off (t = 0.2 s and 1.2 s). The yellow box vertically delineates the estimated spatial region where the lesion was formed based on examination of the macroscopic lesion and horizontally delineates the temporal duration from 0.5 s to 0.7 s after the HIFU was turned off. (B) Probable lesion area marked by red binary mask of ΔIBS(z,t)max thresholded at 12 dB (optimal value from Table 1). (C) Line-to-line echo decorrelation parameter σ(z,t). (D) Areas of bubble activity or motion marked by green binary mask of σ(z,t) thresholded at (see description of Fig. 5B). (E) Composite marked image of grayscale M-mode image (Fig. 2D) with red lesion (Fig. 6B) and green bubble-activity (Fig. 6D) masks superimposed. Yellow pixels occur where red and green pixels are coincident. (F) Photograph of macroscopic tissue cross-section. The yellow vertical dashed line indicates the approximate location of the M-mode line, while the dashed horizontal lines show the correspondence between the M-mode and macroscopic lesion along the lesion boundaries.

