
Figure 2.
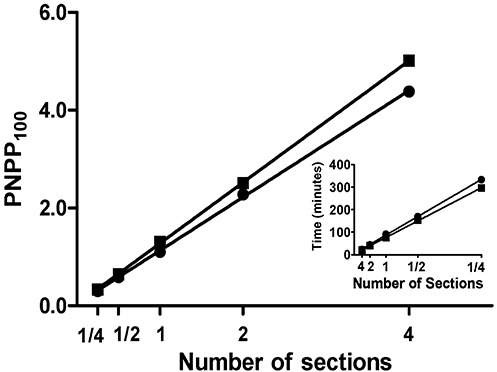
Quantification of synaptophysin signal. Plot of p‐nitrophenyl phosphate (PNPP100) absorbance values and best fit line from linear regression. PNPP100 absorbance values for one‐fourth, one‐half, one, two, or four sections of a given tissue block that were adhered either on glass slides (●, Case 5 in Table 1) or nitrocellulose membranes (■, Case 18 in Table 1) and processed simultaneously. Linear regression showed a near perfect linear relationship (R2 = 1.00) for both glass slides and membranes over this 16‐fold range. Inset: Incubation time in PNPP solution for one‐fourth, one‐half, one, two, or four tissue sections to reach absorbance = 1.00 also was linear (R2 = 1.00) for tissue on both slides and membranes.