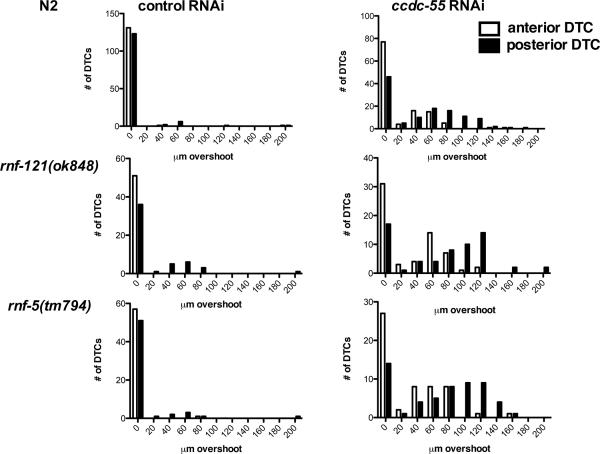
Fig. 7.
Quantification of DTC migration in wildtype, rnf-121 and rnf-5 animals treated with ccdc-55 RNAi. Wildtype (top panels “N2”), rnf-121(ok848) (middle panels) and rnf-5(tm794) (bottom panels) animals were fed E. coli HT115(DE3) expressing sequences from the empty RNAi vector L4440 as a negative control (left) or ccdc-55 RNAi (right). Graphs are histograms of the distribution of distances that DTCs migrated past the vulva. Quantitative data depicted in these histograms were collected from the samples described in Table 1. White bars represent the distribution of anterior DTC positions and black bars represent the distribution of posterior DTC positions in young adult animals.

