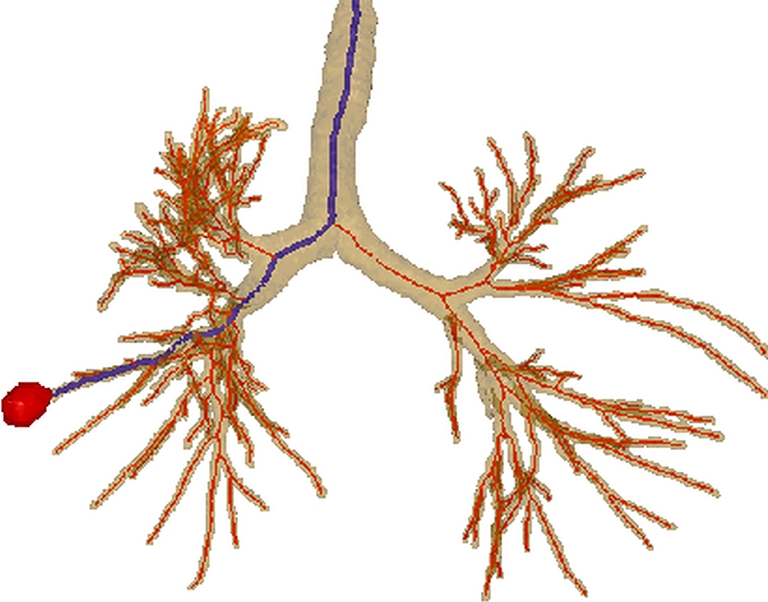
Fig. 2.

Example outputs from 3D airway tree definition and preliminary route computation for case 24 (scan dimensions, 512 × 512 × 608; voxel dimensions, ∆x = ∆y = 0.62 mm, ∆z = 0.5 mm; MDCT scanner, Siemens Sensation-16). The surface rendering depicts the defined airway tree (brown) and airway centerlines (red), in addition to a preliminary route (blue) to a suspect peripheral nodule (red). For this case, the set of airway centerline branches B consisted of M = 315 distinct branches  , while the set of routes R contained only one route r1 as only one ROI was defined. Route r1 consisted of 13 contiguous branches bj ∈ B, starting with the trachea b1
