Fig. 7.
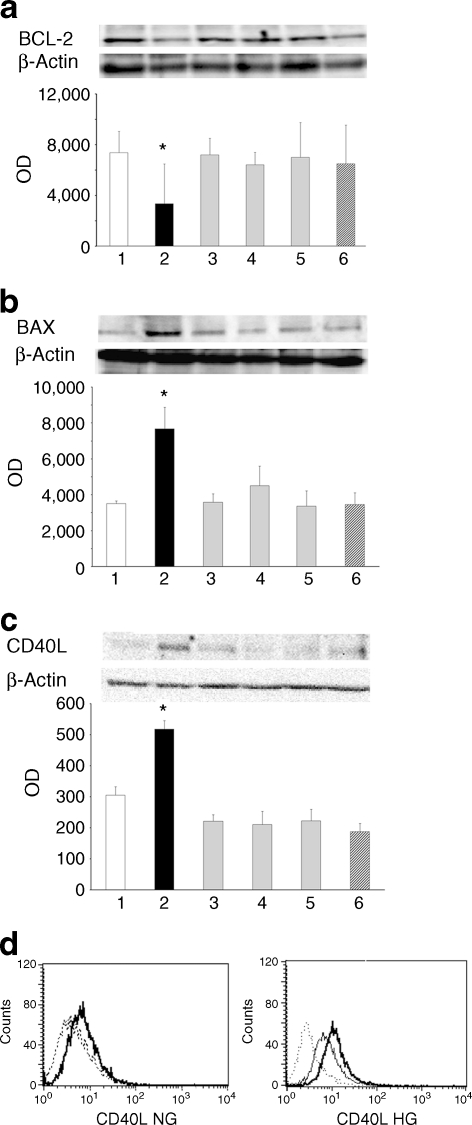
Production of BCL-2, BAX and CD40L. a Production of BCL-2 evaluated as densitometric analysis of western blot bands in islet MECs cultured in normal (1, white bar) or 28 mmol/l glucose (2, black bar) for 7 days or treated with 10 nmol/l of AG (3, grey bar), UAG (4, grey bar), Ob (5, grey bar) or Ex-4 (6, crosshatched bar). b Production of BAX evaluated as densitometric analysis of western blot bands in islet MECs cultured in normal (1, white bar) or 28 mmol/l glucose (2, black bar) for 7 days or treated with 10 nmol/l of AG (3, grey bar), UAG (4, grey bar), Ob (5, grey bar) or Ex-4 (6, crosshatched bar). c Production of CD40L evaluated as densitometric analysis of western blot bands in islet MECs cultured in normal (1, white bar) or 28 mmol/l glucose (2, black bar) for 7 days or treated with 10 nmol/l of AG (3, grey bar), UAG (4, grey bar), Ob (5, grey bar) or Ex-4 (6, crosshatched bar). OD, optical density. Data are expressed as mean ± SD of three different experiments. *p < 0.05 compared with parallel normal glucose and high glucose cultures with peptides. d Representative flow-cytometric analysis of human islet MECs cultured in normal glucose (NG) or in 28 mmol/l glucose (HG) (7 days) with IL-1β (10 ng/ml) and TNF-α (50 mg/ml) for 24 h, stained for CD40L (dark line histograms) and corresponding isotype control antibodies (dashed line histograms). Thin line histogram represents CD40L production in cells treated with 10 nmol/l Ob in high glucose. Three separate experiments showed similar results

