Fig. 4.
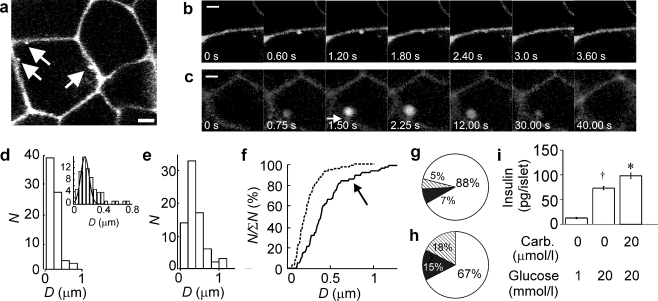
Optical imaging of exocytosis in intact rat islets. a Two-photon excitation microscopy of an intact pancreatic islet perfused with an extracellular solution containing the fluorescent polar tracer SRB (0.7 mmol/l) and 20 mmol/l glucose. Scale bar: 3 μm. The three arrows indicate exocytotic events. b,c Example of a typical single event (b) and a large event (c) in the presence of 20 mmol/l glucose and 20 μmol/l carbachol. Scale bar: 1 μm. Images were taken at the indicated times (relative to the leftmost image). Note that the large event in c appears within the cell and is connected to the exterior by a stalk (dim fluorescence, arrow). d Histogram of diameters (D) of the fluorescent spots reflecting exocytosis in the presence of glucose. The inset shows the distribution on an expanded abscissa. A Gaussian curve with a mean value of 0.23 μm has been superimposed (102 events, 8 islets). e As in d but showing distribution after addition of 20 μmol/l carbachol (100 events, 8 islets). f The same data plotted as the cumulative distribution (N/∑N) of the diameters of exocytotic events evoked by 20 mmol/l glucose alone (dashed line) and 20 mmol/l glucose + 20 μmol/l carbachol (continuous line). Note inflection at ∼0.5 μm on distribution of events collected in the presence of carbachol (arrow). g,h Pie charts summarising relative frequency of single-vesicle (white), sequential (black) and multivesicular (hatched) exocytosis in beta cells within intact rat islets exposed to 20 mmol/l glucose with (h) or without (g) 20 μmol/l carbachol. The data were collected in 13 different islets and based on a total observation period of >3,100 s for each condition. i Insulin secretion measured in the presence of 1 or 20 mmol/glucose during a 1 min incubation. Carbachol (20 μmol/l; Carb.) was included as indicated. *p < 0.005 vs 20 mmol/l glucose alone; †p < 0.001 vs 1 mmol/l glucose

