
Figure 2.
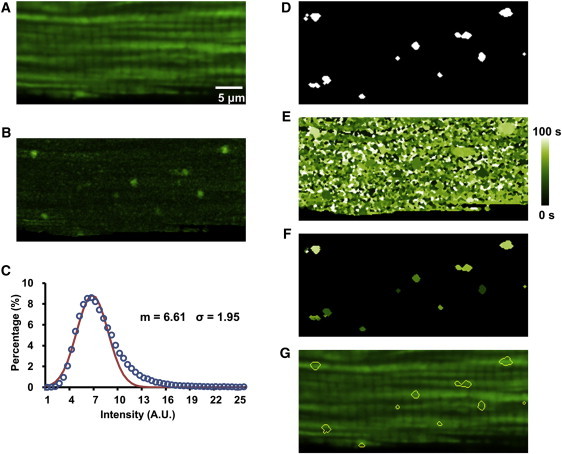
Feature maps for automated detection of superoxide flashes. (A) Averaged cell image showing fluorescent staining of mitochondria. (B) Peak map (ΔFmax) showing maximum increase of fluorescence intensity at each pixel. (C) Histogram of ΔFmax (open circles) and Gaussian fitting of its left portion (solid line), yielding mean (m) and standard deviation (σ). (D) Peak-site map. Binary map after thresholding the peak map at the level of m + kσ; in this case, k = 3. (E) Peak-time map showing the time (0–100 s, color-coded) when local fluorescence increase attained its peak. (F) Combinatorial map derived from D and E, showing tentative flash sites and respective peak times. (G) Overlay of contours of detected flashes on the averaged cell image.