
Figure 1.
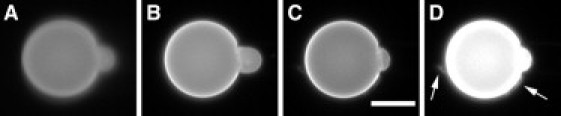
Time sequence of a GUV (7:3 DOPC/DOPG, plus 0.5 mol % Rh-DOPE) containing 200 mM sucrose exposed to 0.25 μM monomeric hIAPP in 199 mM glucose and 1 mM Tris buffer (pH 7.0). (A) t = 0; (B) the protrusion length first increased; (C) the protrusion length then decreased; (D) the high-contrast fluorescence image of (C) shows aggregates (indicated by arrows)—some appeared to be coming off the surface of GUV (see Movie S1 in the Supporting Material). Scale bar = 20 μm.