
Figure 5.
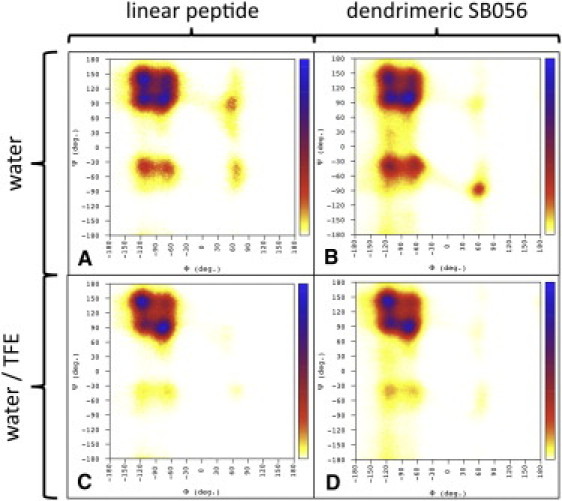
Ramachandran plots obtained from MD simulations. (A) Linear peptide in water. (B) Dendrimeric SB056 in water. (C) Linear peptide in 30% TFE. (D) Dendrimeric SB056 in 30%. The bar on the right represents the probability increasing from 0 to 1.