
Figure 5.
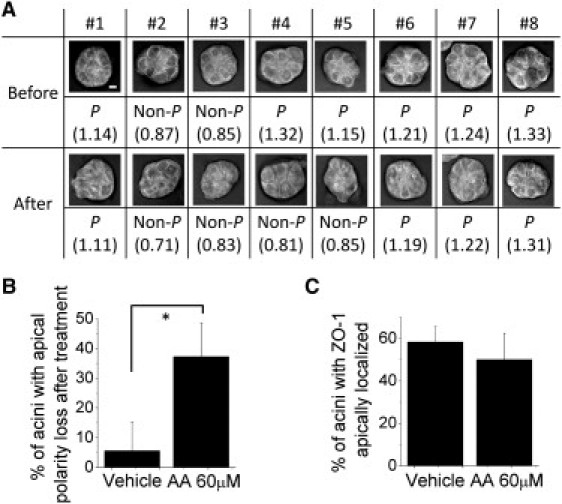
Measurements of the polarity status in acini before and after treatment with ω6 fatty acid. Acini were incubated with either ethanol vehicle or 60 μM AA from day 8 to 12 of 3D culture. (A) Status of apical polarity (polarized, P or Non-P) based on the lipid ordering ratio (ApM_R/BaM_R, number indicated in parenthesis; R = A2885/A2850) for the same group of acini before and after AA treatment as measured by the Raman scattering-based method. (B) Percentage of acini that have lost apical polarity in the control and AA-treated groups at day 12 (after treatment with vehicle or with AA) compared to day 8 (before treatment) detected by the Raman scattering-based method (∗p-value = 0.0066, n = 3 sets of 8 acini). (C) Percentage of acini with ZO-1 apically localized in vehicle control and AA-treated groups at day 12 of 3D culture (using the sample sets analyzed in B). Scale bar, 5 μm.