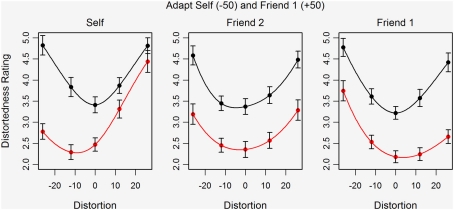
Figure 4.
Mean distortedness ratings for five versions of the test images both before (black) and after adaptation (red) to highly compressed Self and highly expanded Friend 1 faces in Study 2. Error bars show ±standard error of the mean. Separate plots are shown for Self (left), Friend 1 (right), and Friend 2 (center).

