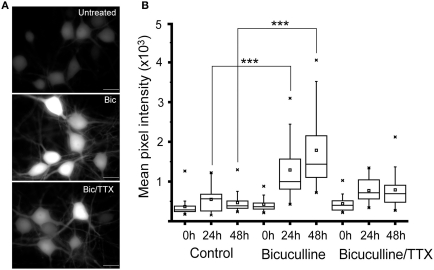
Figure 2.
Suppressing inhibitory activity markedly increases Cycs enhancer-driven GFP expression.(A) Hippocampal neurons were exposed to bicuculline (20 μM) or bicuculline plus TTX (1 μM) for 48 h. Images of living neurons, normalized to the same intensity scale, show marked differences in GFP levels between treatments. Scale bar corresponds to 20 microns. (B) Box and whisker plots showing quantification of GFP expression in the same cultures over time following addition of bicuculline or bicuculline plus TTX. Images of a least 25 cells in 10 fields were analyzed. Mean pixel intensities are in arbitrary units. Between group statistical significance was determined using the paired sample Wilcoxon signed rank test, ***p < 0.001.

