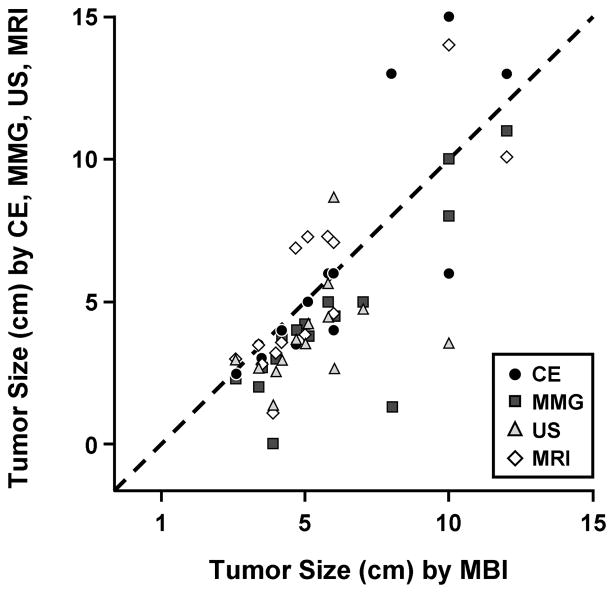
Figure 2.
Pre–Neoadjuvant Therapy Tumor Size. Correlation coefficients show the relation between molecular breast imaging (MBI) and clinical examination (CE) and the various imaging techniques in pre–neoadjuvant therapy estimation of tumor size: CE (r=0.831; P<.01), mammography (MMG [r=0.837; P<.01]), ultrasound (US [r=0.377; P=.17]), and magnetic resonance imaging (MRI [r=0.844; P<.01]).

