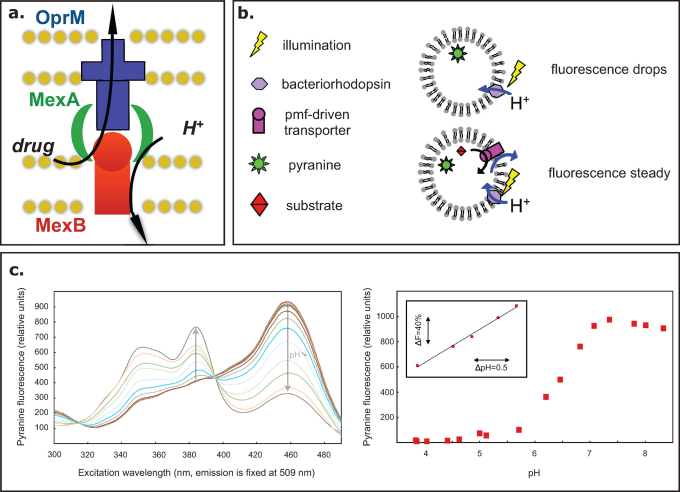
Figure 1. Rationale for the assay.
A. Schematic representation of the MexA-MexB-OprM pump from Pseudomonas aeruginosa. B. Cartoon representation of liposomes reconstituted with BR (upper scheme) or with both BR and a functional and active membrane transporter (lower scheme). C. Pyranine fluorescence as a function of pH. left, excitation spectrum (emission wavelength set to 509 nm) of pyranine measured at pHs ranging from 6.6 to 8.5; right, pyranine fluorescence (λex 455 nm, λem 509 nm) as a function of pH. inset: linear correlation between fluorescence and pH between pH 6 and pH 7. The following linear regression was calculated: Δ fluorescence (%) = 65.9 x ΔpH - 368 (R2 = 0.9946).

