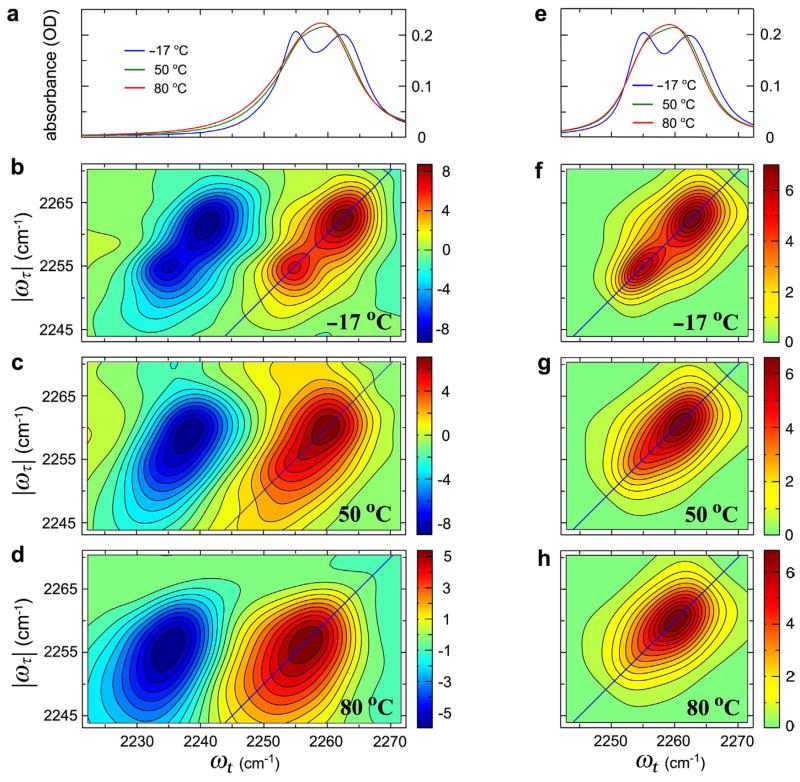
Figure 1.
Experimental (a–d) and simulated (e–h) linear and 2D IR spectra of acetonitrile in methanol. Experimental (a) and simulated (e) linear IR spectra of CH3CN in MeOH at −17, 50, and 80 °C. (b–d) The real part of the purely absorptive 2D IR spectra of CH3CN in MeOH at −17, 50, and 80 °C at waiting time T = 0. (f–h) 2D IR spectra in the region of the v = 0 → v = 1 transition simulated using parameters given in the text at −17, 50, and 80 °C.

