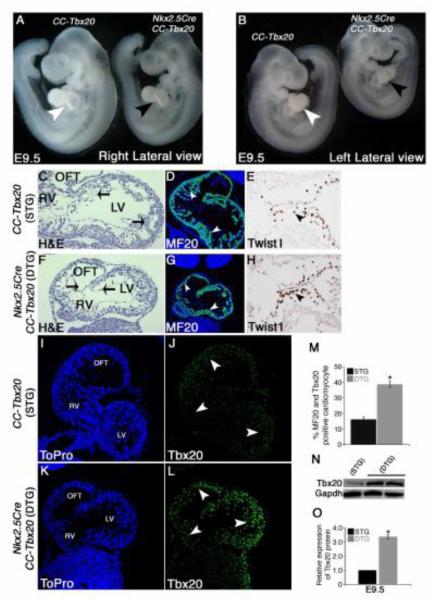
Figure 5. Nkx2.5Cre-mediated Tbx20 overexpression results in a smaller heart with apparently normal endocardial cushion formation.
Nkx2.5Cre-mediated overexpression of Tbx20 results in a smaller heart in E9.5 DTG embryos (black arrowheads in A and B) compared to somite-matched STG embryos (white arrowheads in A and B), displayed in both left (A) and right (B) lateral views. Histological (H&E) and MF20 antibody staining also reveal the smaller heart size in Nkx2.5Cre;CC-Tbx20 (DTG) embryos (compare C versus F and D versus G). The generation of mesenchymal cells and expression of Twist1, indicative of EMT, are apparently normal in the DTG endocardial cushion (arrowhead in H) compared to littermate STG control (arrowhead in E). Tbx20-specific antibody staining reveals Tbx20 overexpression as indicated by positive green nuclei (arrowheads in L), throughout LV, RV and OFT regions of the DTG myocardium compared to the littermate control (arrowheads in J), as detected by immunofluorescence and confocal imaging. (M) Direct cell counts reveal 38.8% of MF20 positive cardiomyocytes are also positive for Tbx20 in DTG ventricular chamber myocardium compared to 16% in littermate controls. (N, O) Quantitative Western blot analysis reveals a 3.4-fold increase of Tbx20 protein expression in E9.5 DTG hearts, compared to littermate STG controls (n = 6-8). Statistical significance is determined by Student’s t test, where * denotes p < 0.05.

