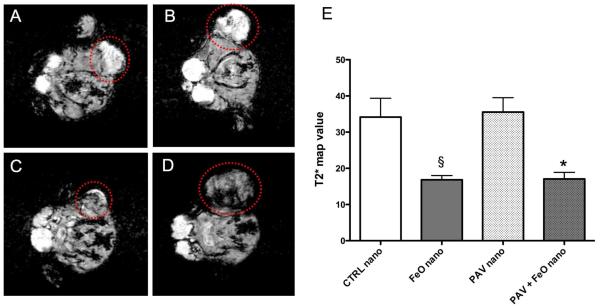
Figure 3. In vivo MRI at end of study.
(A), (B) Selected MR images of PAV-nanoemulsion and CTRL-nanoemulsion injected mice. (C), (D) MR images of PAV+FeO-nanoemulsion and FeO-nanoemulsion injected mice. Red circles indicate the tumors. In (A) and (B) tumors appeared bright as compared to surrounding muscle tissue. In (C) and (D) tumor areas appeared hypointense, indicative of FeO accumulation. (E) T2*-map mean values (ms) of the different groups (* vs. PAV nano P<0.05, § vs CTRL-nano P<0.05).

