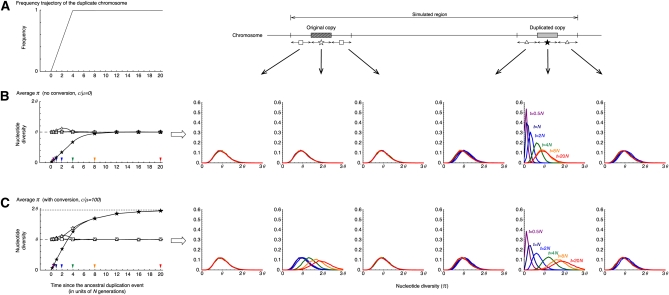
Figure 3 .
The behavior of the nucleotide diversity, π, along the fixation of a new duplicated (class D) chromosome under neutrality. (A) The assumed trajectory of the frequency of the duplicated chromosomes and the subregions where we measured π. We focused on six 1-kb subregions, the 5′-flanking region of the original copy, the original copy, 3′-flanking region of the original copy, 5′-flanking region of the duplicated copy, the duplicated copy, and 1-kb 3′-flanking region of the duplicated copy. (B) Left shows the changes of the average π for each subregion since the duplication event. The dashed line at (π = θ) is the expectation at equilibrium. Right shows the distributions of π for t = 0.5N (purple), N (navy blue), 2N (blue), 4N (green), 8N (orange), and 20N (red) in the six subregions. The results for the 5′- and 3′-flanking regions of the original (duplicated) copy is almost identical; on the left, their average is shown by open squares (triangles). No conversion is assumed. The arrowheads on the left indicate the time points, at which the level of polymorphism was investigated (the result is shown on the right with the same color). (C) Active gene conversion is assumed (C = 1 or c/μ = 100 with the average tract length ℓ = 100). The broken lines at π = 1.95θ and π = θ on the left are the expectations at equilibrium with and without gene conversion, respectively (Innan 2003). n = 100 and θ = R = 0.01 are assumed in the entire simulations. See text for details about the parameters.

