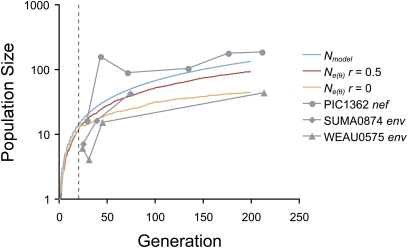
Figure 7 .
Coalescent effective population sizes, Ne(θ), predicted from simulations and estimated from viral sequence data. The model population size, Nmodel, is shown for comparison. Values were predicted for free recombination (r = 0.5) and no recombination (r = 0). Ne(θ) was estimated for the viral genes env and nef from three patients. The vertical dashed line indicates the start of CD8+ T cell responses. Other parameter values are as in Figure 4.

