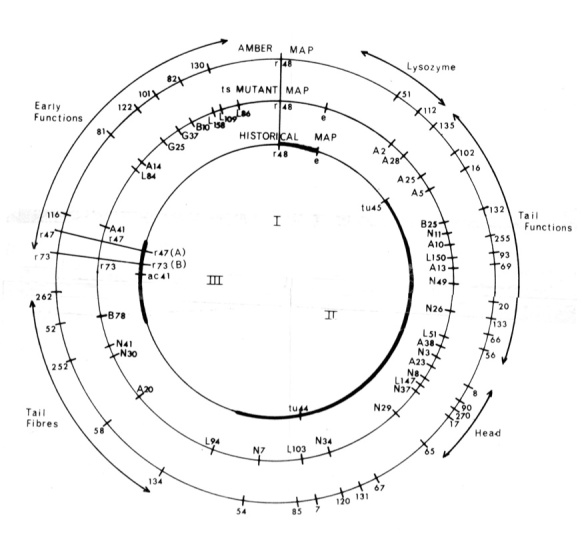
Figure 3 .

The three linkage groups of the historical map are shown in the inner circle. The map of the ts alleles (Edgar and Lielausis 1964) is shown in the middle circle. The map of the am alleles is shown on the outside circle; the prefix of the individual alleles is not indicated but can be found in Epstein et al. (1964); therefore, 51 is amN51 and maps in gene 2. Those am and ts mutants that belong to the same complementation groups are aligned, except for the three gene 29 mutants (tsL103, amB7, and amN85).
