Fig. 4.
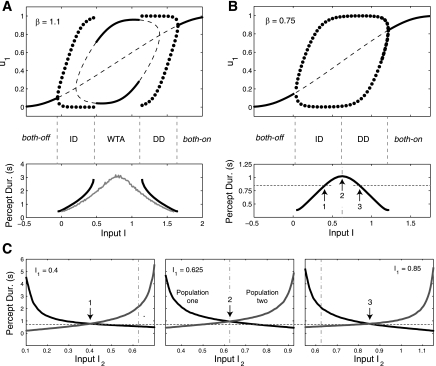
A and B: bifurcation diagram for the LC-SFA model studied in Shpiro et al. (2007) and Curtu et al. (2008) [sigmoid gain function (Eq. 10), adaptation (γ = 0.5), and no depression or recurrent excitation]. Solid lines represent stable fixed points and dotted lines represent unstable fixed points. Solid circles correspond to rivalry and show the maximum and minimum value of u1 for a limit cycle (oscillations) of Eqs. 1–2. A: case where β = 1.1. A winner-take-all (WTA) regime exists for intermediate input. Gray curve shows average periods when noise is added to the net input (σ = 0.03; see Eq. 12). B: case where β = 0.75, with no WTA regime. C: plots showing L1–L3 for the model in B and with σ = 0.03. I1 is fixed at 0.4, 0.625, and 0.85 and I2 is varied. Black and gray curves show average dominance durations for population 1 and 2, respectively. Vertical line is set at 0.625 as a reference for the value that separates the ID and DD regimes in B. Arrows 1, 2, and 3 show different points where I1 = I2 (refer to B). Arrows 1 to 2 show ID, and arrows 2 to 3 show DD (the horizontal dotted line is for reference). Changes in percept duration for L4 (B) are very modest compared with changes for L1–L3 (C). These model predictions are in strong agreement with experimental observations (see text), with only the modest disagreement of L4, which our study shows can easily be fixed.

