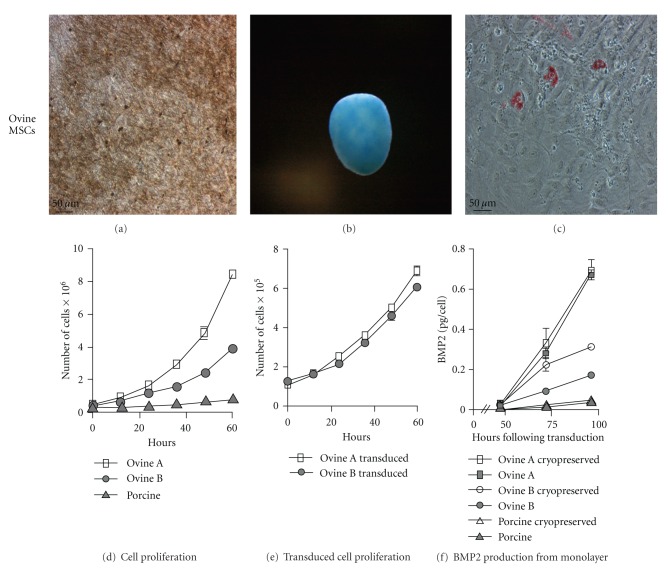
Figure 1.
Characterization of ovine MSCs and proliferation and BMP2 transduction of ovine and porcine MSCs: ovine MSCs (a) osteogenic differentiation is seen through dark staining of calcium depositions by Von Kossa silver nitrate staining. (b) Chondrogenic differentiation with chondroitin sulfate proteoglycans stained blue with Alcian Blue staining, and (c) adipogenic differentiation as seen through intracellular lipid staining with Oil Red O. (d) Ovine A, ovine B, and porcine cell line proliferation rates. (e) Proliferation rates of ovine A and ovine B following transduction with 15,000 vp/cell of adenoviral BMP2. (f) Transduction with 15,000 vp/cell adenoviral BMP2 production from ovine and porcine MSCs both with and without cryopreservation.

