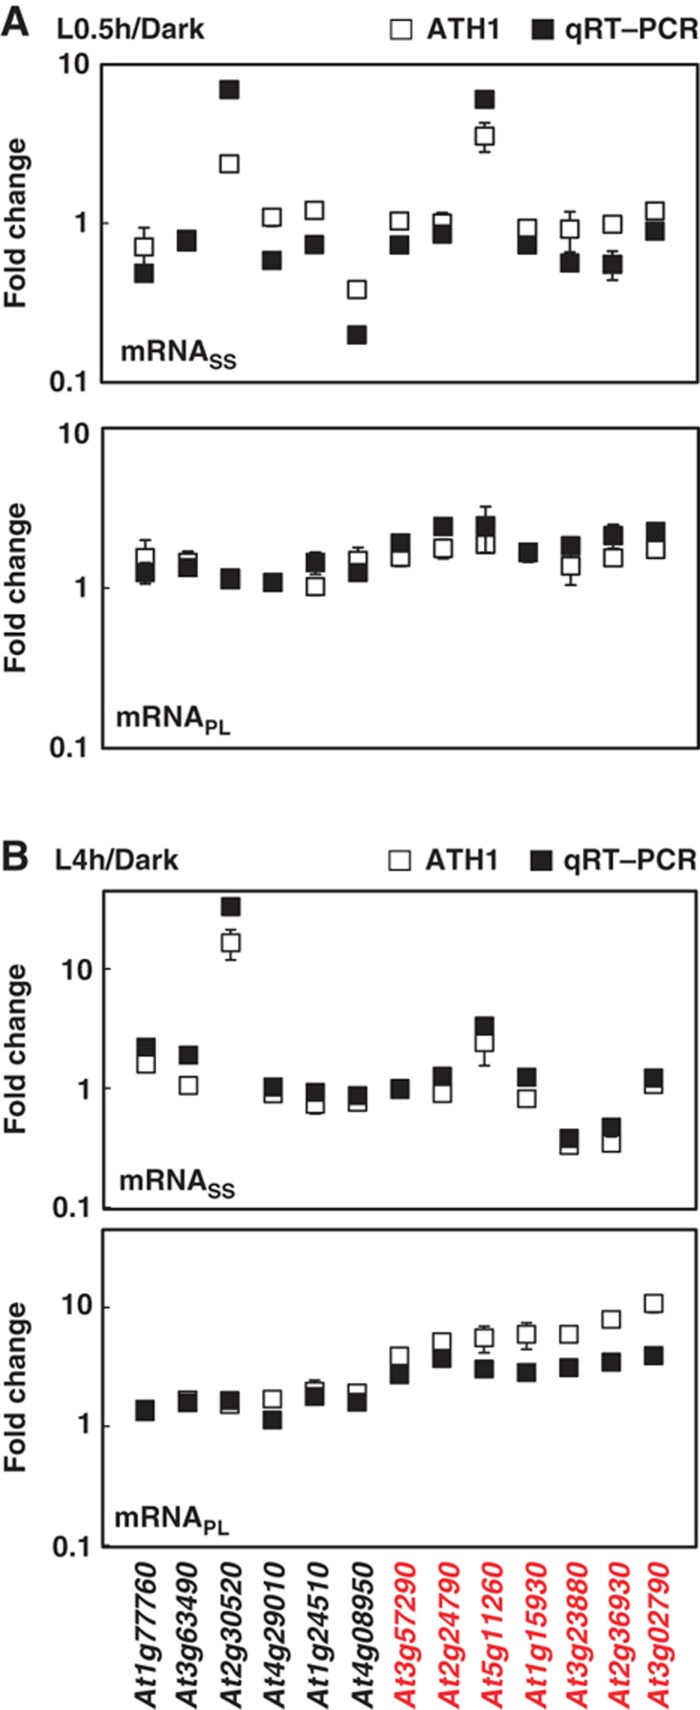
Figure 3.
Confirmation of increased ribosome occupancy by qRT–PCR. Changes in steady-state and polysome-bound mRNA abundance between Dark and L0.5h (A) or between Dark and L4h (B) samples (filled square) with standard deviations were calculated from three technical repeats of one representative biological repeat. Results for an independent biological repeat were shown in Supplementary Figure S3. Transcriptome data obtained from ATH1 hybridization were also plotted (open square), with error bars calculated from three biological repeats. Red color represents genes under translational control. At1g77760, nitrate reductase 1 (NIA1); At3g63490, ribosomal protein L1p/L10e family; At2g30520, root phototropism 2 (RPT2); At4g29010, abnormal inflorescence meristem (AIM1); At1g24510, TCP-1/cpn60 chaperonin family protein; At4g08950, phosphate-responsive 1 family protein; At3g57290, eukaryotic translation initiation factor 3E (eIF3e); At2g24790, constans-like 3 (COL3); At5g11260, elongated hypocotyl 5 (HY5); At1g15930, ribosomal protein S12e (RPS12e); At3g23880, F-box family protein; At2g36930, zinc finger (C2H2 type) family protein; At3g02790, zinc finger (C2H2 type) family protein. Source data is available for this figure in the Supplementary Information.

