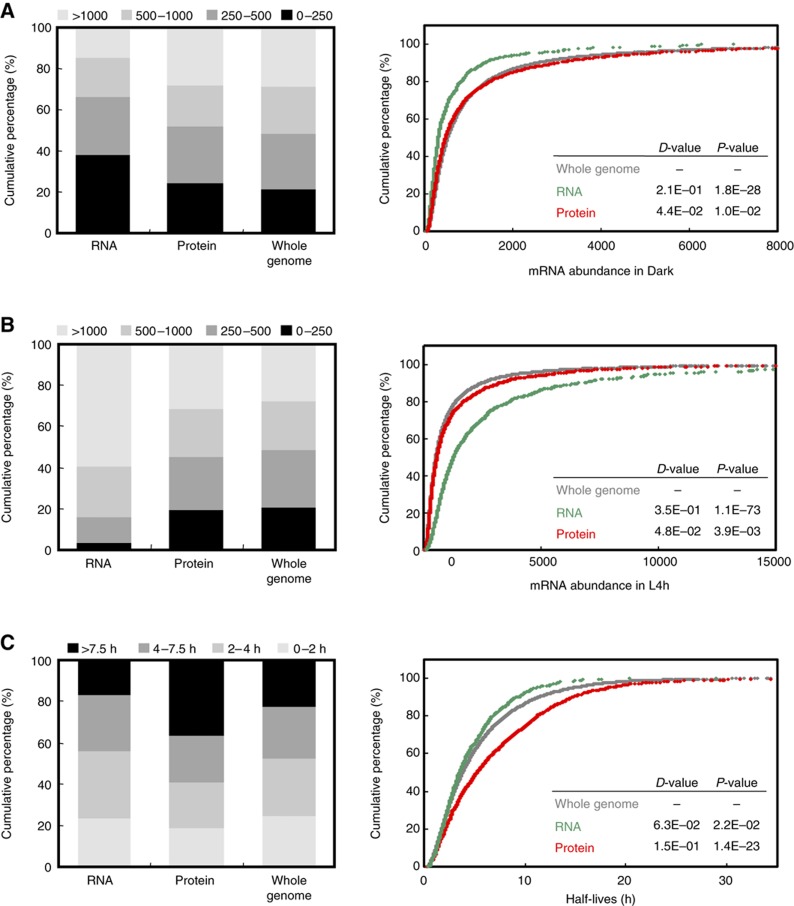
Figure 6.
Light activates translation of transcripts with longer half-lives. Genes in each defined regulatory group were partitioned according to their mRNA abundances in Dark (A), L4h (B) samples and mRNA half-lives (C) and expressed as relative percentages (left panel). The bin size was arbitrarily determined so that the percentage of each category for the whole genome data set was about 25%. The cumulative curves (right panel) show the distribution of mRNA abundances and half-lives for genes in each group. The D-values of the K–S test represent the difference in distribution between the ‘Whole genome’ (gray) and ‘RNA’ (green) or ‘Whole genome’ and ‘Protein’ (red) groups. P-values are also calculated to determine statistically significant differences.

