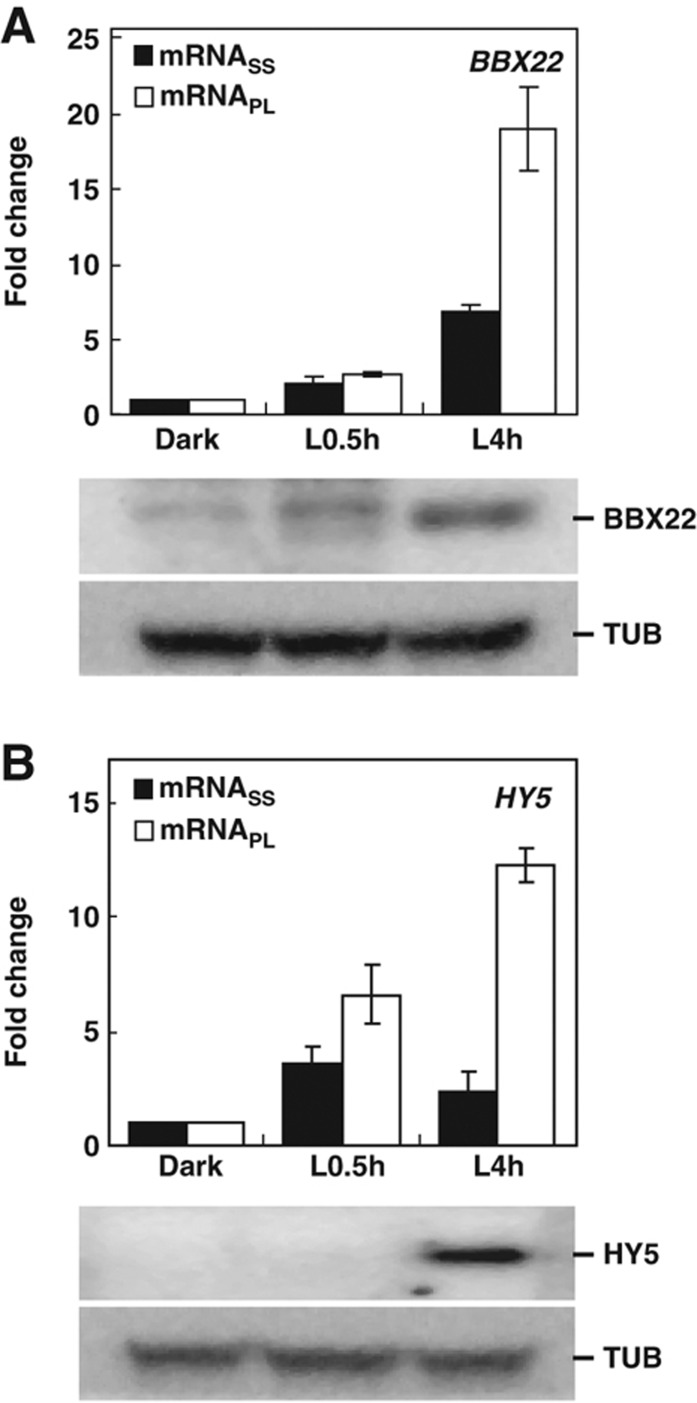
Figure 9.
Experimental validation of light-responsive transcription factors regulated at transcriptional and translational levels. ATH1 expression data for BBX22 (A) and HY5 (B) at mRNASS and mRNAPL levels in Dark, L0.5h and L4h samples are plotted as fold change, with the Dark sample arbitrarily set to 1 (upper panel). Immunoblotting was used to detect BBX22 and HY5 proteins at different times. Endogenous α-tubulin (TUB) was used as a loading control (lower panel). Source data is available for this figure in the Supplementary Information.

