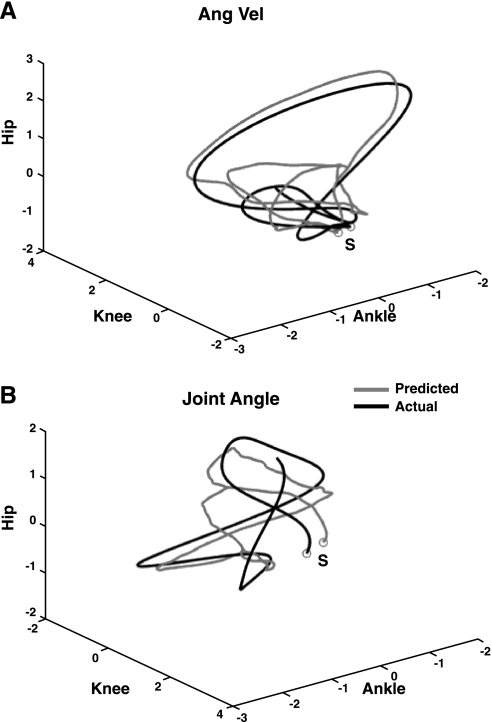
Fig. 4.
Actual and predicted standardized 3D trajectories for angular velocity and joint angle of the ankle for subject S4. Ankle, knee, and hip trajectories are plotted in the x-, y-, and z-axes respectively. The letter “S” represents the starting point. A: trajectories of the predicted (gray) vs. actual (black) angular velocities. B: trajectories of the predicted (gray) vs. actual (black) joint angles.

