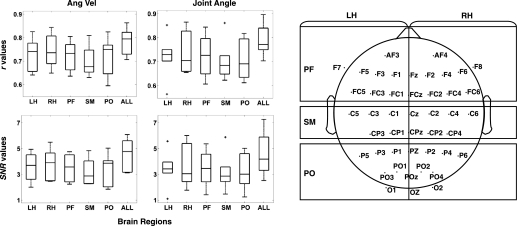
Fig. 6.
Decoding accuracy from different scalp regions of interest (ROIs). Left: box plots show the r and SNR values for the angular velocity and the joint angle calculated with electrodes situated across 5 different scalp areas [left hemisphere (LH), right hemisphere (RH), anterior (PF), centro-medial (SM), and anterior-occipital (PO)] and with all the electrodes (ALL). Right: scalp map depicts the coverage used for each ROI and the location of the electrodes in each ROI. Right and left hemispheres have been separated by the midline. Midline electrodes (along the line linking FZ and OZ) have been included in neither the right nor the left hemisphere ROIs.

