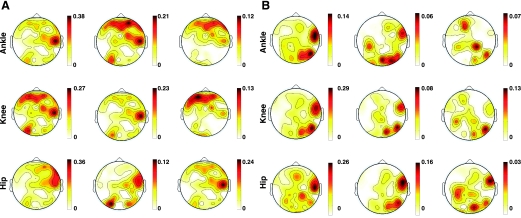
Fig. 7.
Spatial distribution of r2 decoding accuracies across sensors for the “best” (S4, A)- and “worst” (S5, B)-decoded subjects. Scalp maps represent the spatial distribution of r2 across electrodes at the best lag for each parameter resulting from the training of the linear model. From left to right, each column represents the scalp map of the Cartesian positions, joint angles, and angular velocities.

