Abstract
We present a method to assess the in vivo radial strain and strain rate of the myocardial wall, which is of great importance to understand the biomechanics of cardiac development, using tissue Doppler optical coherence tomography (tissue-DOCT). Combining the structure and velocity information acquired from tissue-DOCT, the velocity distribution in the myocardial wall is plotted, from which the radial strain and strain rate is evaluated. The results demonstrate that tissue-DOCT can be used as a useful tool to describe tissue deformation, especially, the biomechanical characteristics of the embryonic heart.
Keywords: Optical coherence tomography, Medical and biological imaging, Cardiac development, Myocardial strain, Embryonic chick heart
1. Introduction
During cardiac development, the local biomechanical environment to which cardiac cells are exposed, influences cell behavior and further cardiac growth and remodeling. Accordingly, the mechanical characteristics of the embryonic heart are of great significance to understand the mechanisms of cardiac development [1–4]. Even at the early stages of heart development, cardiac tissue deforms (expands and contracts) periodically. Exploiting this periodic deformation, which carries critical information about the mechanical characteristics of the embryonic heart [5–7], would thus be a useful approach.
Usually, strain and strain rate measurements are a reliable method to characterize a deformation. Taber et al. [5–7] developed a method to monitor the variation of epicardial strain during cardiac development by tracking the motion of microsphere triangular arrays placed on the external myocardial surface of the embryonic chick heart. However, only 2D myocardial surface strains can be obtained by this method, which does not render radial strains (wall thickening and thinning).
The development of 3D real time in vivo imaging techniques provides new possibilities to evaluate the deformation of the myocardial wall [8–10]. Especially, as optical coherence tomography (OCT) improves, it is becoming more and more uniquely suited for the study of the embryonic heart at its early developmental stages [5, 11–19]. This is mainly due to OCT high temporal and spatial resolutions with an imaging depth of up to 2 mm in highly scattering biological tissue [20, 21]. Recently, Li et al. characterized the radial deformation of the developing heart myocardial wall by analyzing OCT M-mode structural images of the embryonic chick heart [22]. Their method, however, is highly dependent on image segmentation (which is prone to errors) and it is time-consuming: the movement and deformation of the myocardial wall are both evaluated from the variations of extracted (segmented) wall borders over time during the cardiac cycle.
When analyzing motion, Doppler velocimetry is frequently used due to its high accuracy. Combining Doppler technique with OCT, Doppler OCT (DOCT) has been developed for measuring the velocity of blood flow [23–25], including the flow within complex geometry [26, 27]. DOCT has been demonstrated to have potentials in a number of preclinical and clinical applications [28–31], for example retinal blood flow imaging [29, 31], cardiovascular and cerebrovascular imaging [28, 30]. DOCT has also been employed to monitor the blood flow in developing heart [11, 14, 16, 32]. In addition to measuring the velocity of blood flow, DOCT was recently extended to assess the tissue movement and deformation with high accuracy and sensitivity (~0.15 nm for movement and ~0.44%/s for strain rate) [33].
In this study, we describe a method to assess the in vivo radial strain and radial strain rate of the myocardial wall in the early embryonic chick heart using phase-resolved tissue Doppler OCT (tissue-DOCT) technology. Specifically, because of its high imaging speed, we demonstrate that OCT is able to resolve the motion of the myocardial wall as a function of time. The high spatial resolution of OCT enables us to trace the borders of the myocardial wall from serial OCT images. Meanwhile, Doppler analysis provides velocity information along the depth direction. With the help of obtained wall border information, we plot the velocity distribution of the myocardial wall versus the depth of the wall, from which the mean velocity and the velocity gradient (equivalent to the strain rate, see below) can be evaluated. The wall radial strain is then obtained by time integrating the radial strain rate.
2. Material and methods
2.1 Chick embryo preparation
Chick embryos were used as a biological model for cardiac development in this study because of similarities to human heart development and easier access in the egg. We focused on the characterization of myocardial wall deformation in the region of the outflow tract (OFT), at the Hamburger-Hamilton stage (HH18) [34]. The OFT is the distal region of the heart and also a crucial segment of the embryonic heart. It connects the ventricle with the arterial system and functions as a primitive valve by contracting to limit blood flow regurgitation (back-flow). We study the OFT because a large portion of congenital heart defects originate in the OFT [35].
Chick embryo preparation followed standard procedures [36–38]. Under controllable conditions of 38°C and 85% humidity, fertilized white Leghorn chick eggs were incubated blunt-end up in a horizontal rotation incubator to HH18, which is about 3 days of incubation according to Hamburger-Hamilton staging [34]. To expose the embryonic heart for imaging, the egg shell was opened at the air sac end, and a small section of the inner shell membrane was carefully removed. Then the egg was placed into the OCT sample arm for in vivo imaging, with the probing light access from the top. In order to maintain a constant temperature of 37.5°C during image acquisition, a home-built organic glass box equipped with a heating blanket was used to house the egg under the probe. The control signal for the heating blanket was generated in real time by an automatic feedback system with a small thermocouple placed near the embryo.
2.2 OCT system setup
Fig. 1 shows the schematic diagram of the phase-resolved DOCT system used in this study, which was similar to the one previously reported [15]. Briefly, the system was based on a spectral domain configuration. Briefly, in the system, a superluminescent diode (SLD) provided a broadband spectrum with full-width-half-maximum (FWHM) of 52 nm centered at 1321.5 nm, yielding ~14 μm axial resolution in air. The emitted radiation from SLD was coupled into a fiber-based Michelson interferometer via a broadband optical circulator. A 10/90 fiber coupler acted as a beam splitter. The sample light was coupled into a probe consisting of a pair of X-Y galvanometer scanners and an objective lens (focal length f=50 mm, providing a measured lateral resolution of ~16 μm). The interference signal from the two arms was then directed into a home-built spectrometer via the optical circulator. The spectrometer employed a fast InGaAs line scan camera operating at a 47-kHz line scan rate and had a designed spectral resolution of ~0.088 nm, providing a detectable depth range of ~4.6mm in air. With a light power of ~3mW on the sample, the system has ~105 dB sensitivity around the zero-delay line and ~7 dB roll-off from zero to 1.5 mm depth.
Fig. 1.
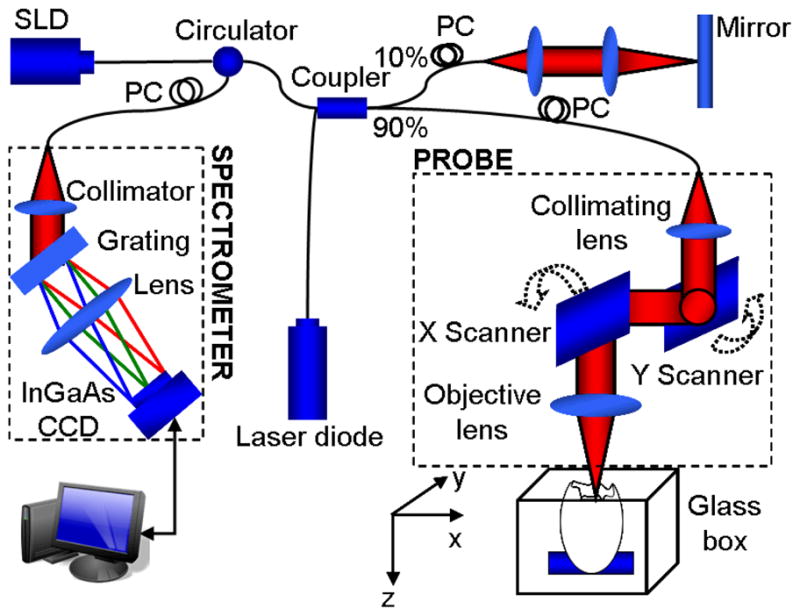
Schematic of a spectral-domain phase-resolved DOCT system
In the X-direction, the probe beam was scanned by an X scanner driven by a saw-tooth waveform. For a lateral B-scan, 256 axial A-lines were acquired to cover ~1.1 mm on the chick embryo heart, with ~75% oversampling ratio between the adjacent two A-scans (lateral diameter of sampling light focus point was ~16 um), corresponding to a B-scan frame rate of ~140 frames per second (fps) with the camera running at 47-kHz A-scan rate. 200 repeated B-scans were acquired as the M-scan, i.e. M-B scan mode, covering 3–4 cardiac periods of the beating heart. The mean velocity, radial strain rate and radial strain of the myocardium were calculated from the obtained M-B dataset.
2.3 Image analysis
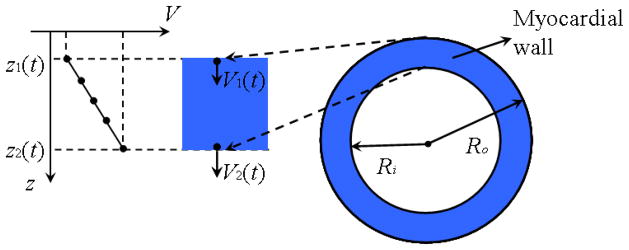
In the heart, the radial strain rate, ε′, is defined as the speed at which myocardial wall thickens [39]. Taking the radial wall deformation (thickening) during contraction for example, as shown in Fig. 2, during an infinitesimal time interval dt, the outer and inner myocardial wall boundaries, located at depth z1(t) and z2 (t) at time t, will move to depth z1(t + dt) and z2 (t + dt) with velocity V1 and V2, respectively. Because of the deformation in the radial direction, the velocity along each A-scan line from depth z1 to z2 is not constant: there is a velocity gradient along the myocardial thickness (as shown in Fig. 2).
Fig. 2.
Diagram of myocardial wall deformation.
It is usually assumed that the myocardial wall is almost incompressible, that is the volume of the myocardial wall is constant over the cardiac cycle. If we neglect longitudinal motions of the heart and assume an approximately circular myocardium, the area of the myocardium in our B-scans should be constant and can be expressed as following:
| (1) |
where Ro and Ri are the outer and inner myocardium radii, respectively. Differentiating Eq. (1) with respect to time yields:
| (2) |
where dRo/dt and dRi/dt are the velocities of the outer and inner myocardial wall V1 and V2, respectively. This equation should be true for any radius R inside the wall, that is:
| (3) |
where V = dR/dt is the velocity at depth z, corresponding to radius R ; x = z − z1 is the distance from the outer myocardial wall to depth z, and thus x is within the range [0, h], where h is the myocardium thickness. Because the myocardial wall is thin, assuming that x ≪ Ro, Eq. (3) simplifies to:
| (4) |
Therefore, the velocity along the myocardial thickness is linear, and thus the velocity gradient in the myocardial wall is constant.
Following Ref. [39], the radial strain rate can be defined as:
| (5) |
where Δz(t) is the wall thickness at time t. Because of the linear velocity distribution along the myocardial wall, the radial strain rate ε′ can be assessed by linear fit to the Doppler velocity curve of the myocardial wall. Additionally, the natural radial strain can be obtained by [39]:
| (5) |
With the OCT imaging system described above, 200 sequential 2D cross-sectional images at the same location, i.e., M-B scans representing a 3D (2D sectional data + time) data cube, were acquired in vivo from the beating embryonic chick heart. From these images, both structural data and phase (Doppler) data can be extracted. Using the data cube, we extracted the wall borders of the myocardial wall over time, and the corresponding Doppler velocity distribution within the myocardial wall, from which the variation of the myocardial wall radial strain rate during the periodic cardiac cycle was calculated (see below).
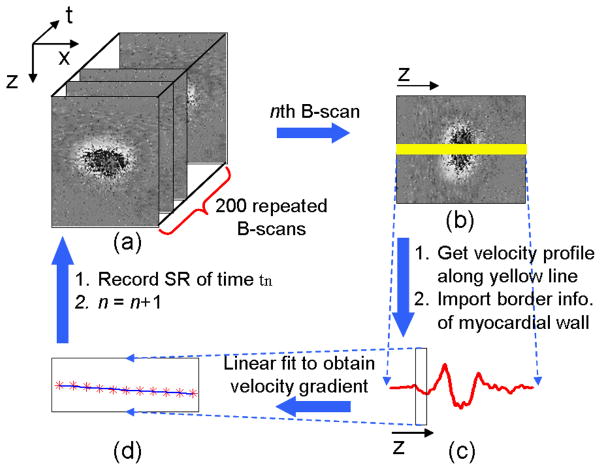
Figure 3 shows the flow chart used to extract the myocardial wall radial strain rate. First, structural and phase images (Fig. 3a) from time t1 to t200 were obtained from the acquired dataset. Phase images were obtained by calculating the phase differences Δϕ between two adjacent A-scans in a B-scan. This phase difference is introduced by the movement of tissue and cells, such as the myocardial wall and blood. Phase images can be easily converted to Doppler velocity images [16]:
| (6) |
where λ0 is the central wavelength; n is the refractive index of tissue (~1.35); τ is the time difference between the two adjacent A-scans (~21μs for 47-kHz A-scan rate). Because only radial wall deformation is discussed here, we used Doppler velocity profiles along the line (yellow line in Fig. 3b) passing through the center of the lumen for each phase image. As shown in Ref. [22], the myocardial wall border can be obtained from corresponding M-mode structural images along the same line. Knowing the location of the wall border, we can find the corresponding region of the myocardial wall in the curve of Doppler velocity versus depth z (as indicated by the box in Fig. 3c) for each time tn. And then, the velocity gradient of the myocardial wall at time tn, i.e. ε′(tn), can be obtained (Fig. 3d).
Fig. 3.
Flow chart of myocardial wall strain rate extraction: (a) processing OCT M-B structural and phase images; (b) reading the nth B-scan; (c) calculating the velocity profile (Doppler velocity data) along the yellow line in (b), and meanwhile, identifying the corresponding myocardial wall thickness from the structural images; (d) performing linear fit to the Doppler data over the myocardial wall thickness to obtain the velocity gradient, i.e. strain rate.
3. Results and discussion
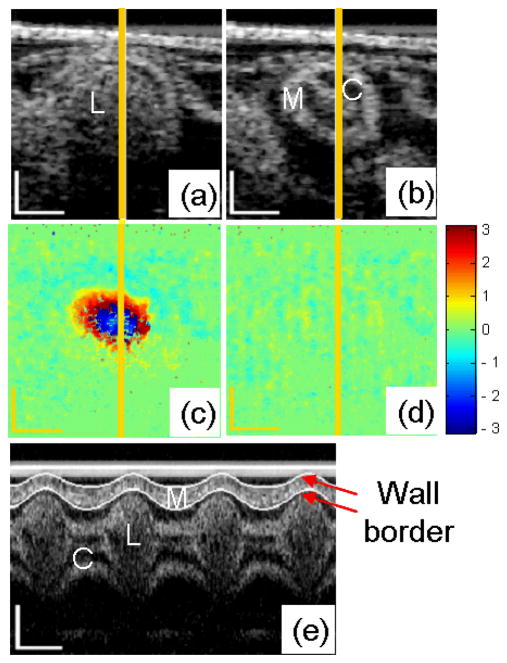
Cross sectional morphological (structural) images and phase images of the embryonic chick heart OFT, as well as extracted M-mode structural images along the central line of the heart OFT cross-section are shown in Fig. 4. The microstructures within the OFT wall, e.g., OFT lumen, cardiac jelly and myocardium, can be distinctly identified from the cross-sectional images (Fig. 4a and 4b). When the OFT is most expanded, the blood flows through the lumen with a relatively high speed, resulting in a large phase shift Δϕ in the area of the lumen (Fig. 4c). When the OFT is most contracted, there is either no blood flow through the lumen or blood flows with a relatively low speed, and the phase shift Δϕ is around zero (Fig. 4d). The border of the myocardial wall can be clearly identified from M-mode structural images (see Fig. 4.e), and thus we used our border extraction algorithm, to segment the myocardial wall borders over time (white curves in Fig. 4e). From the border traces, the myocardial wall thickness, which periodically varies as a function of time during the cardiac cycle [22], was extracted.
Fig. 4.
OCT images of HH18 chick OFT. Typical cross-sectional images when the OFT is most expanded (a) and contracted (b); and the corresponding phase images (c) and (d); M-mode structural image along the yellow line (e). M: myocardium; C: cardiac jelly; L: lumen. The scale bars in (a), (b), (c), (d) and the vertical scale bar in (e) represent 200μm; the lateral scale bar in (e) represents 0.2s.
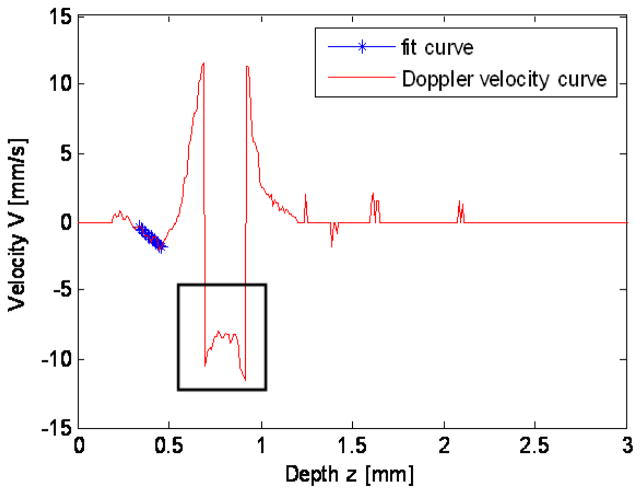
Figure 5 shows the Doppler velocity profile calculated along the yellow line in Fig. 4c, when the OFT is most expanded. Since blood flows through the lumen with high velocity, in the center of the lumen, the phase shift caused by the blood flow exceeds the range of [−π, π], leading to a sudden phase jump, which is usually referred to as phase ‘wrapping’, shown by the black box in Fig. 5. This phase jump, and the associated inaccuracies in calculating velocities, can be corrected using a phase unwrapping algorithm [16]. In this study, however, we are interested in the velocity distribution in the myocardial wall (as shown by the star line in Fig. 5), which does not present wrapping.
Fig. 5.
Doppler velocity profile along the yellow line in Fig. 4c. The black box indicates phase wrapping; the star line indicates the region of the myocardial wall, in which the velocity profile is linear.
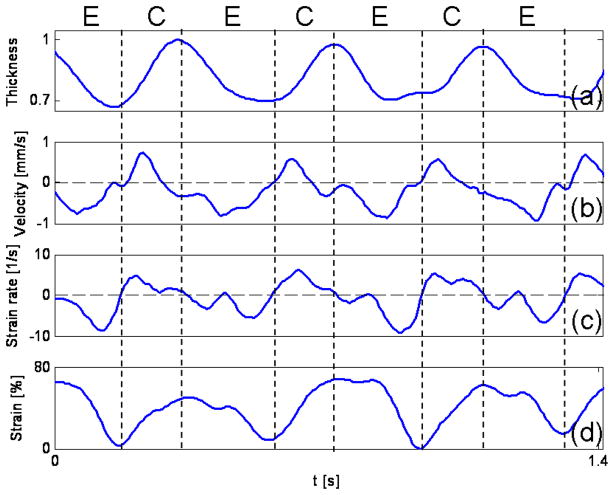
The normalized thickness, mean velocity, radial strain rate (the slope of the fit ‘star’ curve in Fig. 5) and radial strain (calculated according to Eq. 5) of the myocardial wall were plotted versus time in Fig. 6. The thickness of the myocardial wall, obtained from the M-mode structural image extracted from the acquired B-mode images (as shown in Fig. 4e), varies periodically over time, as expected. Since we calculated the radial strain rate as the slope of the velocity profile in the wall, using a linear fit of the Doppler velocity data (see Fig. 5), we ensured that the selected region of the Doppler data, in which the linear fit was performed, was located within the myocardial wall. In order to minimize the error introduced by image segmentation, the analyzed wall thickness was reduced to ~80% compared with the segmented wall thickness. For the OCT system employed to acquire images, however, the depth pixel resolution is low. Because the myocardial wall is thin, there were only ~10–20 pixels located in the myocardial wall. Thus, this small pixel count introduced larger measurement errors. However, with improvements in the OCT camera, the number of pixels spanning the myocardial wall may be increased. Also, the pixel resolution can be improved by reducing the imaging depth. And then the proposed method will render more accurate results.
Fig. 6.
Thickening and thinning of the developing chick heart myocardial wall over the cardiac cycle analyzed from OCT images. Normalized wall thickness (a), mean wall velocity (b), radial wall strain rate, SR (c) and radial wall strain (d) of an HH18 chick OFT. The vertical dash lines show cardiac phases, E: expansion phase; C: contraction phase.
The mean radial velocity was calculated using half the sum of the Doppler velocity of myocardial outer and inner borders which can be obtained from the linear fit curve in Fig. 5. We found that the maximum mean velocity is about 0.8 mm/s, comparable to the result of Jenkins et al. (approximately 0.8 mm/s maximum) in quail embryos [40], and our previous results of OFT myocardial contraction wall velocities from HH18 chicken embryos (average wall velocities ranged between 0.2 to 0.6 mm/s) [13].
The obtained maximum mean velocity value (~0.8 mm/s), however, is higher than our previous results (about 0.2 mm/s maximum), obtained by analyzing the motion of the wall border over time using structural feature tracking approach [22]. This discrepancy in the maximal mean velocity may be due to the system setup and the method used to evaluate the wall velocity. In the current OCT system, the imaging depth was ~4.6 mm in air (512 pixels), corresponding to ~7 μm per pixel in tissue (refraction index ~1.3). The B-frame rate was 140 fps, corresponding to ~7 ms per frame. Thus, if the structural feature tracking approach were used to monitor the wall motion, the minimum resolvable velocity would be ~1 mm/s, making it difficult to extract the wall velocity versus time. To mitigate this problem, an additional method was used to decrease the minimum resolvable motion (< 1 pixel), in which the entire border of the myocardial wall was extracted via interpolating the curve between the selected seeded points [41]. This procedure is prone to errors. Particularly for the rapid motion, the smoothing effect of the interpolation would make the measured velocity smaller than the real value.
In addition, due to the fast beat of the chick heart (2 – 2.5Hz at HH18), and in order to appropriately sample the cardiac cycle with B-mode images, the A-scan oversampling density in our OCT system was low, allowing for an increased time resolution (140 frames/sec) but also resulting in increased phase noise (shown by the fluctuations in the mean velocity observed in Fig. 6b).
Besides, the strain rate values obtained by tissue Doppler are relatively higher than the values obtained using M-mode structural imaging (the maximum was ~5 s-1) [22]. In addition to the reasons listed above, this discrepancy could also be attributed to the fact that we used different methods, in agreement with the results of Fleming et al. [42]. In their work, similar deviations were observed between pulse-echo and Doppler images for the strain rate measurement of the mature left-ventricle posterior wall using ultrasound techniques. Mostly due to the same reasons, the obtained strain (~70%) by tissue Doppler is higher than the values (~50%) obtained by OCT M-mode structural imaging [22].
Ideally, in order to extract the radial strain and strain rate, the OCT probing light should be perpendicular to the myocardial wall, so that Doppler velocity data correspond exactly to radial tissue velocities. This is also the case when calculating radial myocardial wall strains and rates from M-mode structural imaging alone (using wall border segmentation). The requirement of having the OCT probing light perpendicular to the myocardial wall, however, is hard to achieve in practice. Fortunately, even though the amplitude and velocity of the deformation is influenced by the direction of probing light, because both velocity and radial thickness are affected by the probe-beam angle in the same way, the resulting strain and strain rate curves are not significantly impacted, provided that the angle between the direction of probing light and radial direction of wall deformation does not change greatly during imaging. In addition, there is usually a longitudinal motion in the myocardial wall, which disturbs the Doppler velocity distribution and results in fluctuations of the velocity curve across the myocardial wall. Even so, if the longitudinal motion is approximately constant across the myocardial wall, the slope of the Doppler velocity curve versus the depth will be minimally affected. Nevertheless, strain and strain rate periodicity is generally in good agreement with the cardiac cycle. Radial strain rate values become positive and negative, corresponding to myocardium contraction and the expansion phases, respectively.
Generally speaking, strain and strain rate measurements extracted from OCT M-mode structural images as shown in Ref [22] is highly dependent on the image segmentation to trace the borders of the myocardial wall during the cardiac cycle. Border extraction, in turn, is dependent on the magnitude signal of OCT, which is influenced by the OCT system noise and spatial resolution. Comparatively, in the method using tissue Doppler OCT, the precision of the strain and strain rate measurement is mainly dependent on the obtained velocity distribution of the myocardial wall. Because radial velocity distribution in the myocardial wall has a linear distribution profile, the strain rate can be obtained from several velocity points along the wall thickness, by calculating the slope of the velocity curve. This has several advantages. First, strain rates can be obtained from any part of the velocity distribution, and thus the calculation does not require precise estimation of wall borders. Thus, the method of tissue Doppler OCT reduces the dependency of the results on the image segmentation. Second, by linear fitting several data points, noise in the Doppler velocity data is reduced, and thus more accurate strain rates are expected. Third, the proposed method exploits Doppler phase data, which is widely used for velocity measurements. Although our results are currently limited by the phase noise and the low pixel resolution of our system, these limitations are expected to be overcome by increasing the imaging speed and the pixel number of the OCT camera.
4. Conclusion
Radial strain and strain rate measurements in the in vivo embryonic chick heart, provides a powerful approach in the investigations of the biomechanics of cardiac development. As an important extension of the method that uses OCT M-mode structural images for evaluating the radial deformation of the myocardial wall that occurs in the embryonic chick heart, we have proposed here a method that uses tissue Doppler OCT. Both methods to calculate radial strains and strain rates in the developing heart complement each other and add to our ability to study the dynamic mechanical characteristics of the embryonic beating heart.
Acknowledgments
This work was supported by an NIH grant, R01HL094570, from the National Heart, Blood and Lung Institute.
References
- 1.Clark EB, Hu N, Frommelt P, Vandekieft GK, Dummett JL, Tomanek RJ. Effect of increased pressure on ventricular growth in stage 21 chick embryos. Am J Physiol. 1989;257:H55–61. doi: 10.1152/ajpheart.1989.257.1.H55. [DOI] [PubMed] [Google Scholar]
- 2.Fishman MC, Stainier DY. Cardiovascular development. Prospects for a genetic approach. Circ Res. 1994;74:757–763. doi: 10.1161/01.res.74.5.757. [DOI] [PubMed] [Google Scholar]
- 3.Groenendijk BC, Hierck BP, Vrolijk J, Baiker M, Pourquie MJ, Gittenberger-de Groot AC, Poelmann RE. Changes in shear stress-related gene expression after experimentally altered venous return in the chicken embryo. Circ Res. 2005;96:1291–1298. doi: 10.1161/01.RES.0000171901.40952.0d. [DOI] [PubMed] [Google Scholar]
- 4.Hove JR, Koster RW, Forouhar AS, Acevedo-Bolton G, Fraser SE, Gharib M. Intracardiac fluid forces are an essential epigenetic factor for embryonic cardiogenesis. Nature. 2003;421:172–177. doi: 10.1038/nature01282. [DOI] [PubMed] [Google Scholar]
- 5.Filas BA, Efimov IR, Taber LA. Optical coherence tomography as a tool for measuring morphogenetic deformation of the looping heart. Anat Rec (Hoboken) 2007;290:1057–1068. doi: 10.1002/ar.20575. [DOI] [PubMed] [Google Scholar]
- 6.Alford PW, Taber LA. Regional epicardial strain in the embryonic chick heart during the early looping stages. J Biomech. 2003;36:1135–1141. doi: 10.1016/s0021-9290(03)00089-7. [DOI] [PubMed] [Google Scholar]
- 7.Taber L, Sun H, Clark E, Keller B. Epicardial strains in embryonic chick ventricle at stages 16 through 24. Circ Res. 1994;75:896–903. doi: 10.1161/01.res.75.5.896. [DOI] [PubMed] [Google Scholar]
- 8.Rademakers FE, Bogaert J. Left ventricular myocardial tagging. Int J Card Imaging. 1997;13:233–245. doi: 10.1023/a:1005731100601. [DOI] [PubMed] [Google Scholar]
- 9.Guth B, Savage R, White F, Hagan A, Samtoy L, Bloor C. Detection of ischemic wall dysfunction: Comparison between M-mode echocardiography and sonomicrometry. American Heart Journal. 1984;107:449–457. doi: 10.1016/0002-8703(84)90085-1. [DOI] [PubMed] [Google Scholar]
- 10.Sutherland GR, Stewart MJ, Groundstroem KW, Moran CM, Fleming A, Guell-Peris FJ, Riemersma RA, Fenn LN, Fox KA, McDicken WN. Color Doppler myocardial imaging: a new technique for the assessment of myocardial function. J Am Soc Echocardiogr. 1994;7:441–458. doi: 10.1016/s0894-7317(14)80001-1. [DOI] [PubMed] [Google Scholar]
- 11.Davis AM, Rothenberg FG, Shepherd N, Izatt JA. In vivo spectral domain optical coherence tomography volumetric imaging and spectral Doppler velocimetry of early stage embryonic chicken heart development. J Opt Soc Am A Opt Image Sci Vis. 2008;25:3134–3143. doi: 10.1364/josaa.25.003134. [DOI] [PubMed] [Google Scholar]
- 12.Männer J, Thrane L, Norozi K, Yelbuz TM. High-resolution in vivo imaging of the cross-sectional deformations of contracting embryonic heart loops using optical coherence tomography. Developmental Dynamics. 2008;237:953–961. doi: 10.1002/dvdy.21483. [DOI] [PubMed] [Google Scholar]
- 13.Rugonyi S, Shaut C, Liu A, Thornburg K, Wang RK. Changes in wall motion and blood flow in the outflow tract of chick embryonic hearts observed with optical coherence tomography after outflow tract banding and vitelline-vein ligation. Phys Med Biol. 2008;53:5077–5091. doi: 10.1088/0031-9155/53/18/015. [DOI] [PubMed] [Google Scholar]
- 14.Davis A, Izatt J, Rothenberg F. Quantitative measurement of blood flow dynamics in embryonic vasculature using spectral Doppler velocimetry. Anat Rec (Hoboken) 2009;292:311–319. doi: 10.1002/ar.20808. [DOI] [PMC free article] [PubMed] [Google Scholar]
- 15.Liu A, Wang R, Thornburg KL, Rugonyi S. Efficient postacquisition synchronization of 4-D nongated cardiac images obtained from optical coherence tomography: application to 4-D reconstruction of the chick embryonic heart. J Biomed Opt. 2009;14:044020. doi: 10.1117/1.3184462. [DOI] [PubMed] [Google Scholar]
- 16.Ma Z, Liu A, Yin X, Troyer A, Thornburg K, Wang RK, Rugonyi S. Measurement of absolute blood flow velocity in outflow tract of HH18 chicken embryo based on 4D reconstruction using spectral domain optical coherence tomography. Biomed Opt Express. 2010;1:798–811. doi: 10.1364/BOE.1.000798. [DOI] [PMC free article] [PubMed] [Google Scholar]
- 17.Gargesha M, Jenkins MW, Wilson DL, Rollins AM. High temporal resolution OCT using image-based retrospective gating. Opt Express. 2009;17:10786–10799. doi: 10.1364/oe.17.010786. [DOI] [PMC free article] [PubMed] [Google Scholar]
- 18.Sudheendran N, Syed SH, Dickinson ME, Larina IV, Larin KV. Speckle variance OCT imaging of the vasculature in live mammalian embryos. Laser Physics Letters. 2011;8:247–252. [Google Scholar]
- 19.Bhat S, Larina IV, Larin KV, Dickinson ME, Liebling M. Multiple-cardiac-cycle noise reduction in dynamic optical coherence tomography of the embryonic heart and vasculature. Opt Lett. 2009;34:3704–3706. doi: 10.1364/OL.34.003704. [DOI] [PMC free article] [PubMed] [Google Scholar]
- 20.Fercher AF. Optical coherence tomography - development, principles, applications. Z Med Phys. 2003;20:251–276. doi: 10.1016/j.zemedi.2009.11.002. [DOI] [PubMed] [Google Scholar]
- 21.Tomlins PH, Wang RK. Theory, developments and applications of optical coherence tomography. Journal of Physics D: Applied Physics. 2005;38:2519. [Google Scholar]
- 22.Li P, Yin X, Shi L, Liu A, Rugonyi S, Wang R. Measurement of strain and strain rate in embryonic chick heart in vivo using spectral domain optical coherence tomography. IEEE Trans Biomed Eng. 2011 doi: 10.1109/TBME.2011.2153851. [DOI] [PMC free article] [PubMed] [Google Scholar]
- 23.Izatt JA, Kulkarni MD, Yazdanfar S, Barton JK, Welch AJ. In vivo bidirectional color Doppler flow imaging of picoliter blood volumes using optical coherence tomography. Opt Lett. 1997;22:1439–1441. doi: 10.1364/ol.22.001439. [DOI] [PubMed] [Google Scholar]
- 24.Zhao Y, Chen Z, Saxer C, Xiang S, de Boer JF, Nelson JS. Phase-resolved optical coherence tomography and optical Doppler tomography for imaging blood flow in human skin with fast scanning speed and high velocity sensitivity. Opt Lett. 2000;25:114–116. doi: 10.1364/ol.25.000114. [DOI] [PubMed] [Google Scholar]
- 25.Ding Z, Zhao Y, Ren H, Nelson J, Chen Z. Real-time phase-resolved optical coherence tomography and optical Doppler tomography. Opt Express. 2002;10:236–245. doi: 10.1364/oe.10.000236. [DOI] [PubMed] [Google Scholar]
- 26.Bonesi M, Proskurin S, Meglinski I. Imaging of subcutaneous blood vessels and flow velocity profiles by optical coherence tomography. Laser Physics. 2010;20:891–899. [Google Scholar]
- 27.Wang RK. High-resolution visualization of fluid dynamics with Doppler optical coherence tomography. Measurement Science and Technology. 2004;15:725. [Google Scholar]
- 28.Bonesi M, Matcher S, Meglinski I. Doppler optical coherence tomography in cardiovascular applications. Laser Physics. 2010;20:1491–1499. [Google Scholar]
- 29.Singh ASG, Kolbitsch C, Schmoll T, Leitgeb RA. Stable absolute flow estimation with Doppler OCT based on virtual circumpapillary scans. Biomed Opt Express. 2010;1:1047–1059. doi: 10.1364/BOE.1.001047. [DOI] [PMC free article] [PubMed] [Google Scholar]
- 30.Jia Y, Li P, Wang RK. Optical microangiography provides an ability to monitor responses of cerebral microcirculation to hypoxia and hyperoxia in mice. Journal of Biomedical Optics. 2011;16:096019. doi: 10.1117/1.3625238. [DOI] [PMC free article] [PubMed] [Google Scholar]
- 31.Wang RK, An L, Francis P, Wilson DJ. Depth-resolved imaging of capillary networks in retina and choroid using ultrahigh sensitive optical microangiography. Opt Lett. 2010;35:1467–1469. doi: 10.1364/OL.35.001467. [DOI] [PMC free article] [PubMed] [Google Scholar]
- 32.Jenkins MW, Peterson L, Gu S, Gargesha M, Wilson DL, Watanabe M, Rollins AM. Measuring hemodynamics in the developing heart tube with four-dimensional gated Doppler optical coherence tomography. J Biomed Opt. 2010;15:066022. doi: 10.1117/1.3509382. [DOI] [PMC free article] [PubMed] [Google Scholar]
- 33.Wang RK, Ma Z, Kirkpatrick SJ. Tissue Doppler optical coherence elastography for real time strain rate and strain mapping of soft tissue. Applied Physics Letters. 2006;89:144103. [Google Scholar]
- 34.Hamburger V, Hamilton HL. A series of normal stages in the development of the chick embryo. Journal of Morphology. 1951;88:49–92. [PubMed] [Google Scholar]
- 35.Gittenberger-de Groot AC, Bartelings MM, Deruiter MC, Poelmann RE. Basics of cardiac development for the understanding of congenital heart malformations. Pediatr Res. 2005;57:169–176. doi: 10.1203/01.PDR.0000148710.69159.61. [DOI] [PubMed] [Google Scholar]
- 36.Clark EB, Rosenquist GC. Spectrum of cardiovascular anomalies following cardiac loop constriction in the chick embryo. Birth Defects Orig Artic Ser. 1978;14:431–442. [PubMed] [Google Scholar]
- 37.Hu N, Connuck DM, Keller BB, Clark EB. Diastolic filling characteristics in the stage 12 to 27 chick embryo ventricle. Pediatr Res. 1991;29:334–337. doi: 10.1203/00006450-199104000-00002. [DOI] [PubMed] [Google Scholar]
- 38.Keller BB, Hu N, Serrino PJ, Clark EB. Ventricular pressure-area loop characteristics in the stage 16 to 24 chick embryo. Circ Res. 1991;68:226–231. doi: 10.1161/01.res.68.1.226. [DOI] [PubMed] [Google Scholar]
- 39.D’Hooge J, Heimdal A, Jamal F, Kukulski T, Bijnens B, Rademakers F, Hatle L, Suetens P, Sutherland GR. Regional strain and strain rate measurements by cardiac ultrasound: principles, implementation and limitations. Eur J Echocardiogr. 2000;1:154–170. doi: 10.1053/euje.2000.0031. [DOI] [PubMed] [Google Scholar]
- 40.Jenkins MW, Adler DC, Gargesha M, Huber R, Rothenberg F, Belding J, Watanabe M, Wilson DL, Fujimoto JG, Rollins AM. Ultrahigh-speed optical coherence tomography imaging and visualization of the embryonic avian heart using a buffered Fourier Domain Mode Locked laser. Opt Express. 2007;15:6251–6267. doi: 10.1364/oe.15.006251. [DOI] [PMC free article] [PubMed] [Google Scholar]
- 41.Fujimoto S, Oki T, Tabata T, Tanaka H, Yamada H, Oishi Y, Ishimoto T, Ito S, Abe Y, Kanda R. Novel approach to the quantitation of regional left ventricular systolic and diastolic function using tissue Doppler imaging to create a myocardial velocity profile and gradient. Circ J. 2003;67:416–422. doi: 10.1253/circj.67.416. [DOI] [PubMed] [Google Scholar]
- 42.Fleming AD, Xia X, McDicken WN, Sutherland GR, Fenn L. Myocardial velocity gradients detected by Doppler imaging. Br J Radiol. 1994;67:679–688. doi: 10.1259/0007-1285-67-799-679. [DOI] [PubMed] [Google Scholar]


