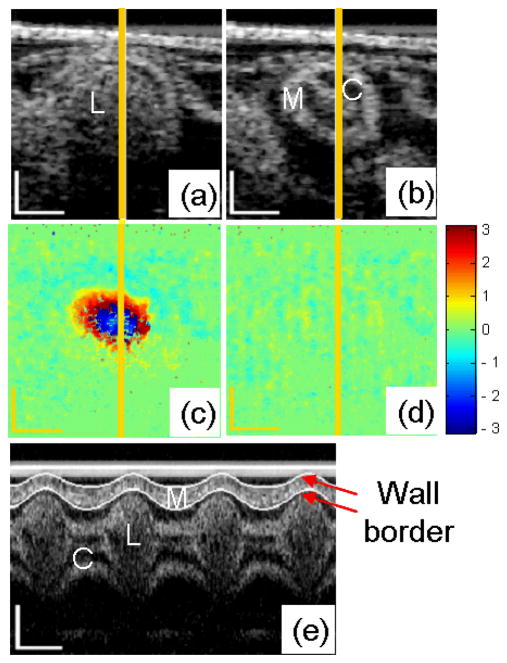
Fig. 4.
OCT images of HH18 chick OFT. Typical cross-sectional images when the OFT is most expanded (a) and contracted (b); and the corresponding phase images (c) and (d); M-mode structural image along the yellow line (e). M: myocardium; C: cardiac jelly; L: lumen. The scale bars in (a), (b), (c), (d) and the vertical scale bar in (e) represent 200μm; the lateral scale bar in (e) represents 0.2s.

