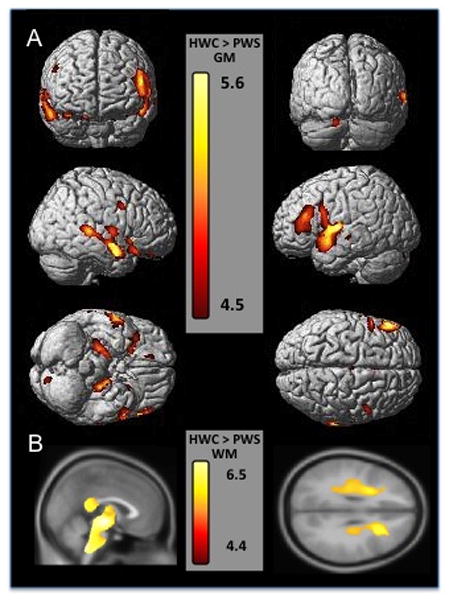
Figure 1. Cortical regions show smaller gray and white matter volume in the PWS group compared to healthy-weight controls.

Gray matter regions are displayed on a 3-D surface-rendered standard brain and white matter regions are displayed on a 2-D standard brain. A. The top row of section A shows a frontal view on the left and posterior view on the right of the cortex, demonstrating bilateral frontal gray matter decreases. The middle row of section A shows left and right outer views of the cortex showing the temporal and frontal decreases in gray matter volume. The bottom row of section A shows a ventral view on the left and a dorsal view on the right, demonstrating orbitofrontal and medial temporal (limbic) decreases in gray matter volume. B. Section B shows sagittal and axial views of white matter volume decreases in PWS subjects, highlighting the midbrain, brainstem, thalamic and corpus callosum white matter decreases (all part of a large cluster) on the left, and on the right showing decreases in the inferior frontal and precentral cortices. Results are displayed at p<.05 FWE corrected, Z score range shown on the color bar.
