
Figure 2. Cortical regions from genetic subtype comparison of HWC to the deletion group (A, C) and the UPD group (B, D).
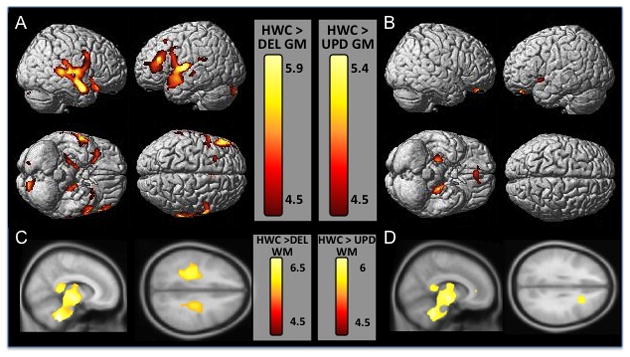
Gray matter regions are displayed on a 3-D surface-rendered standard brain (A, B) and white matter regions are displayed on a 2-D standard brain (C,D). A. The top row of section A shows left and right lateral views of gray matter volume decreases in DEL subjects compared to HWC, highlighting the temporal and frontal decreases in this group. The bottom row of section A shows ventral and dorsal views, displaying decreases in hippocampal and prefrontal gray matter. C. Row C shows sagittal and axial views of white matter volume decreases in HWC subjects. B. The top row of section B shows left and right lateral views of gray matter volume decreases in UPD subjects compared to HWC. The bottom row of section B shows ventral and dorsal views, displaying decreases in hippocampal and orbitofrontal cortical gray matter. D. Row D shows sagittal and axial views of white matter volume decreases in UPD subjects. Results are displayed at p<.05 FWE corrected, Z score range shown on the color bar.