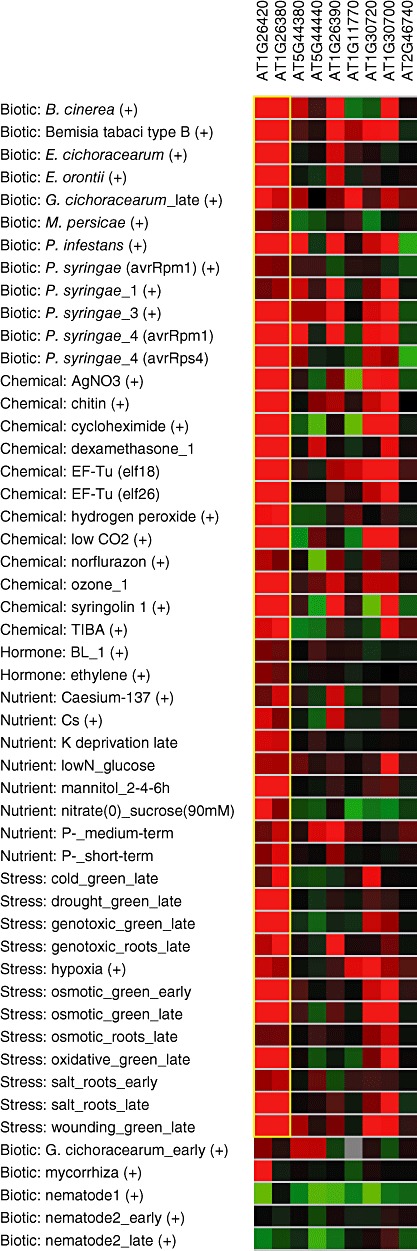
Figure 2.

BiMax clustering of flavin adenine dinucleotide (FAD)‐binding domain‐containing genes. Red indicates induction and green indicates suppression, with brighter colours indicating a greater effect of the indicated treatment. The yellow box indicates the two genes with highly similar expression patterns over the indicated treatments.
