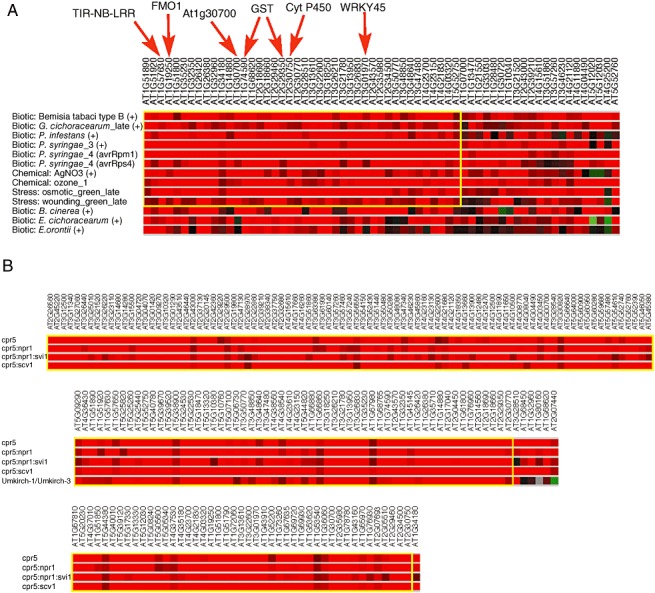
Figure 4.

BiMax cluster analysis of edr1&pm‐upregulated genes. (A) Cluster analysis across the set of experiments housed within Genevestigator under the ‘stimulus’ category. (B) Cluster analysis across the set of experiments housed under the ‘mutant’ category. Only the largest clusters are shown, bounded by the yellow box in each.
