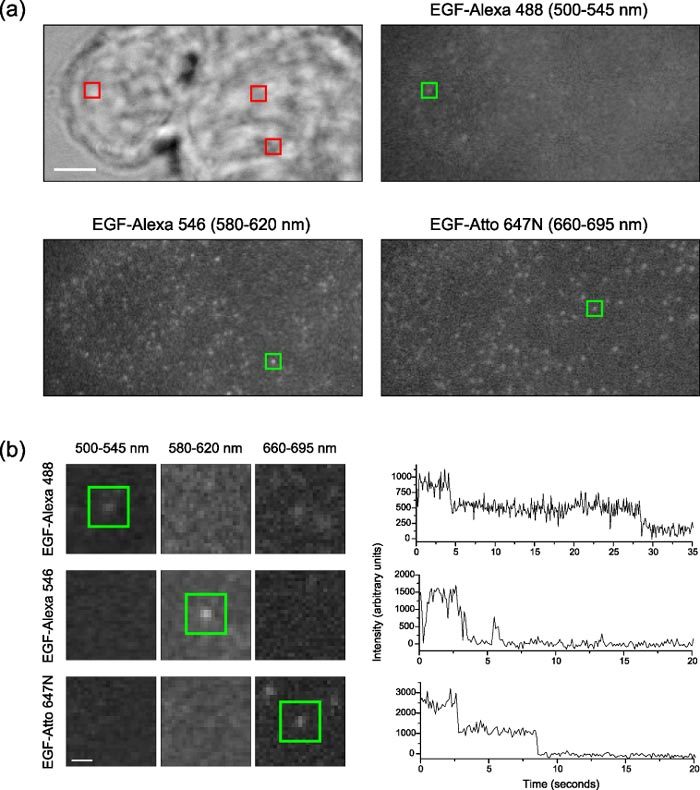
Fig. 3.

Multicolour single molecule imaging with supercontinuum excitation. (a) White light transmission and single molecule fluorescence images of live T47D cells labelled with EGF-Alexa 488, EGF-Alexa 546 and EGF-Atto 647N, focused at the basolateral membrane. Images were acquired at 10 Hz. Scale bar = 5 µm. (Note: Image registration was performed on the acquired sub-images, which were then remapped to a common reference space to produce the images shown here.) The green squares indicate the molecules analysed in (b), whose locations within the cell are indicated by the red squares. (b) Detail images of the areas around the three analysed molecules in each wavelength band and plots of the intensities of the molecules over time. Scale bar = 1 µm.
