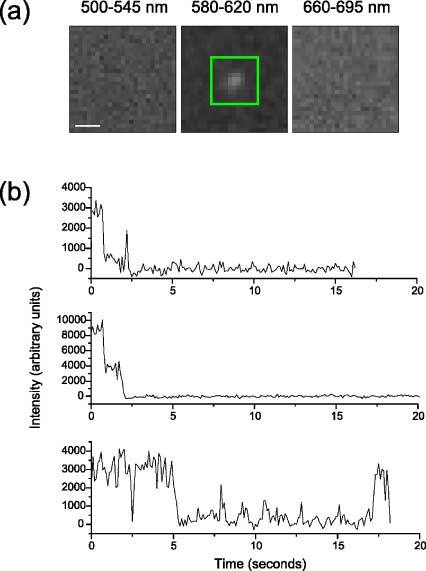
Fig. 4.

Multicolour single molecule imaging with multiplexed single-wavelength laser excitation. (a) Detail images of the area around two colocalised EGF-Alexa 546 molecules on live T47D cells, in each wavelength band. Images were acquired at 10 Hz. Scale bar = 1 µm. (b) Intensities of typical EGF-Alexa 488, EGF-Alexa 546 and EGF-Atto 647N molecules.
