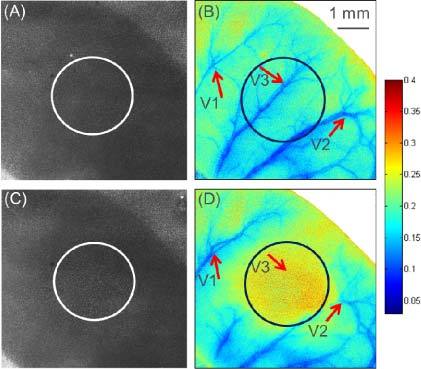
Fig. 2.

2-LSI diffuse reflectance and speckle contrast images of the mouse pinna. (A) Diffuse reflectance, and (B) speckle contrast image of the mouse pinna before the burn. (C) Diffuse reflectance, and (D) speckle contrast image of the mouse pinna after the burn. The circles indicate the burned area. The arrows indicate representative vessels that are affected by the burn injury. Color bar shows the speckle contrast value (K).
