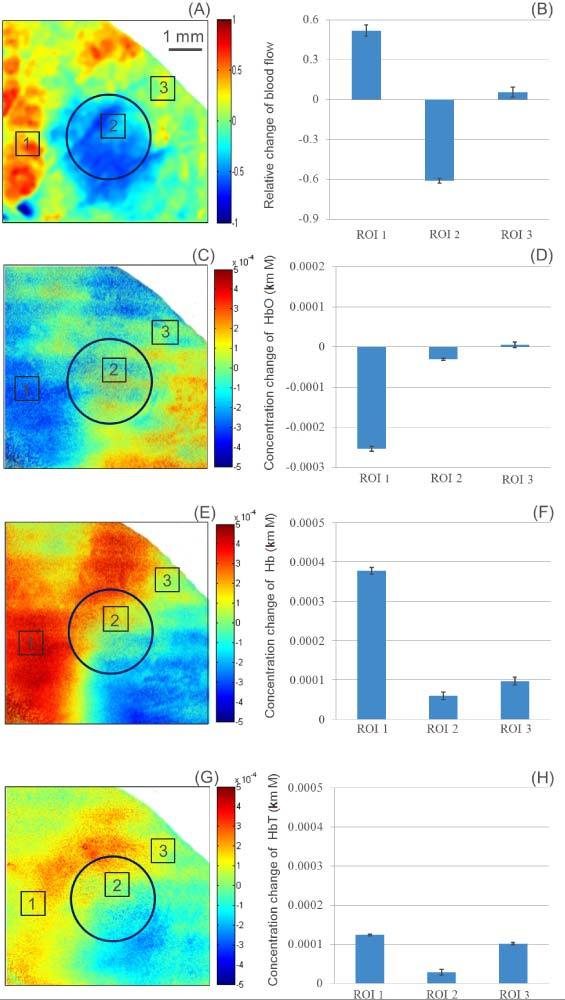
Fig. 3.

Color coded map of the relative change of blood flow (A), HbO (C), Hb (E) and HbT (G). Mean and standard deviations of the relative change of blood flow (B), HbO (D), Hb (F) and HbT (G), from the three regions of interest. The circle indicates the burned area.
