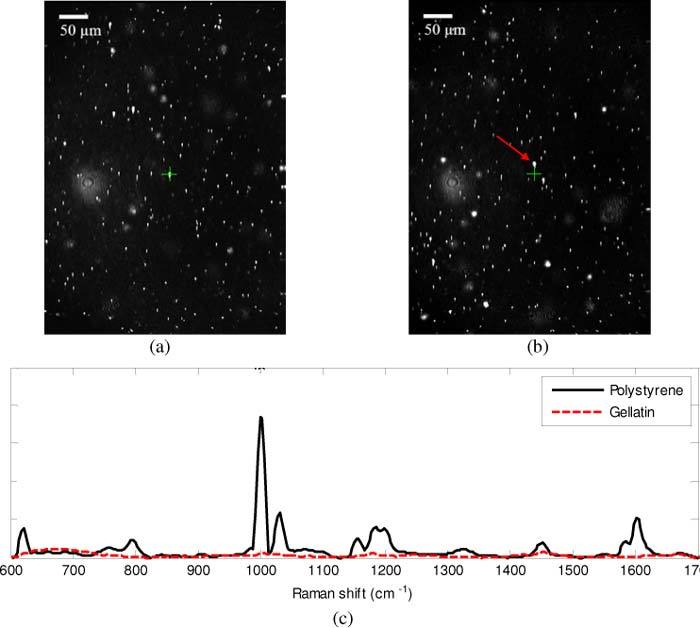
Fig. 5.

Co-registration of Raman sampling location and confocal imaging was done using 5 µm polystyrene microspheres in gelatin solution. Crosshairs mark the Raman sampling location. On (a) and off (b) the microsphere shows distinction in Raman spectra (c), where the spectra corresponding to (a) is shown as the solid black line, and the spectra corresponding to (b) is shown as the dashed red line. The spectrum acquired on the bead clearly shows the characteristic spectral features of polystyrene, including the prominent peaks at 628, 1011, 1034, and 1613 cm−1 [14]. Image dimensions in (a) and (b) is 520 x 396 µm.
