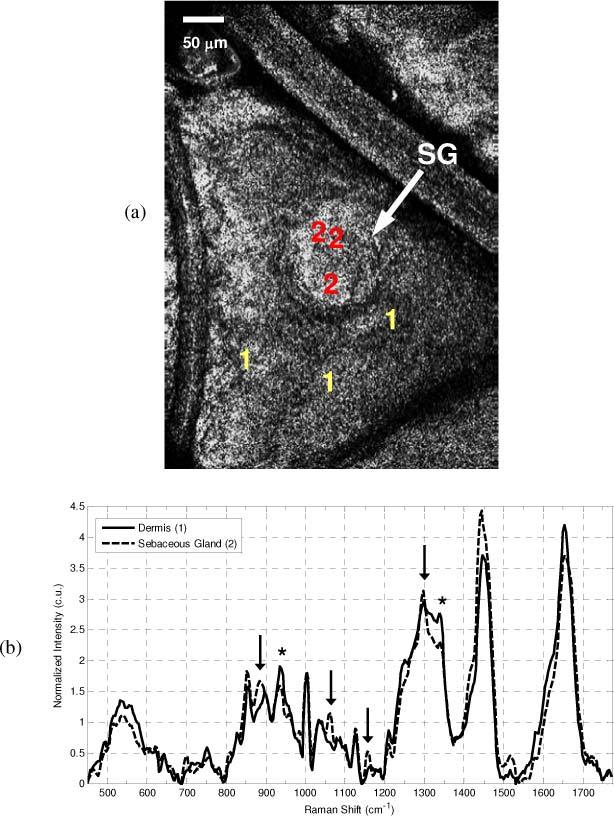
Fig. 7.

In vivo CM image and CRS spectra of a sebaceous gland and the adjacent skin taken with 50x objective. (a) CM image shows the presence of the large circular sebaceous gland (SG) in the center of the image, and indicates the positions from which spectra were acquired (+)(Red-Dermis, Purple-Sebaceous). (b) Mean spectra acquired from within the sebaceous gland (purple line) and from the adjacent dermis (red line). Spectral features characteristic of the fatty acids within sebum are seen at 884,, 1062, 1157 cm−1, and 1297 cm−1 (arrows), while typical tissue protein features (*) such as those at 936 and 1339 cm−1 are more prevalent in the adjacent skin.
