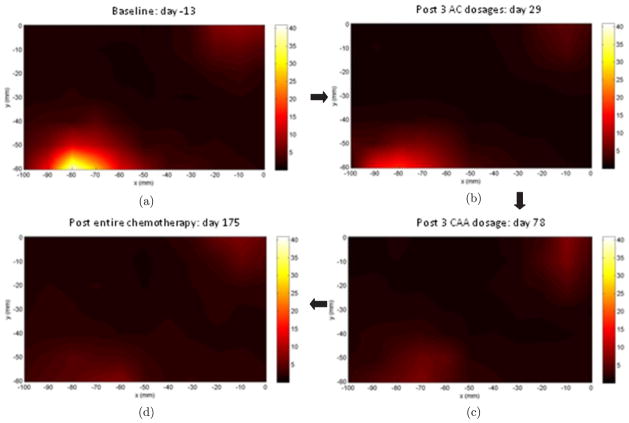
Fig. 6.
TOI images at the same time points measured as the temperature images in Fig. 5. In clock-wise order: (a) baseline, (b) after 3 doses of AC, (c) after 3 doses of CAA, (d) after completion of the therapy. The color bar is the contrast of TOI = (ctHb × ctH2O/ctLipid).

