
Figure 2.
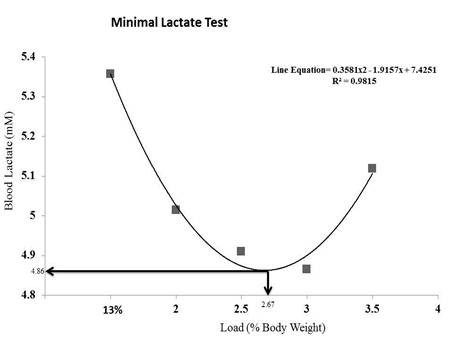
Lactacidemia and lactate threshold equivalent overload of one animal during the minimum lactate test. C = Control; S = Strength Training; AS = Concurrent Training; A = Aerobic Training. n = 8 animals per group. Results are expressed as the mean ± standard deviation. Different letters indicate the significant differences between groups (p ≤ 0.05).