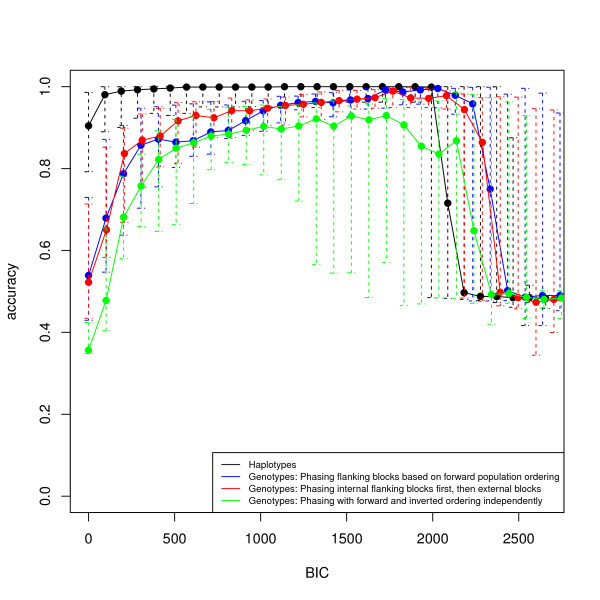
Figure 2.
Accuracy in classification of chromosomes (haplotype data) and subjects (genotype data) into normal and inverted subpopulations. We compute the classification of individuals according to Equation 7 using the sliding window segments, from Figure 1 that overlap and have BIC > tB in one simulation sample. We compare results for the our method on haplotypes and three local phasing procedures for genotype data. Error bars indicate data within the second and third quartile.

