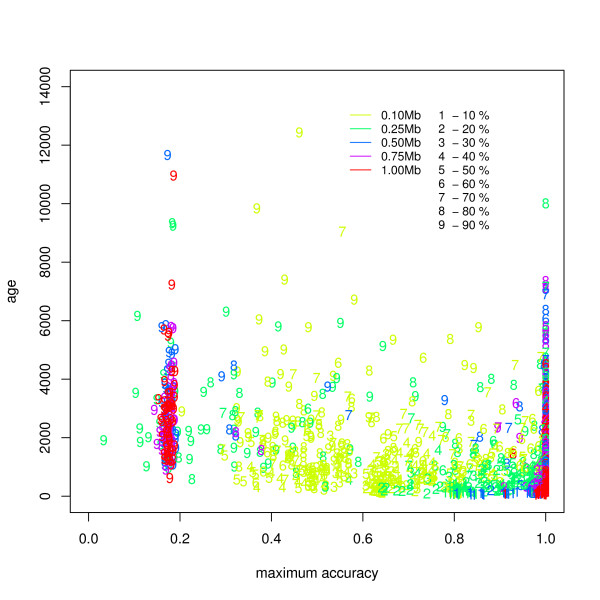
Figure 5.
Maximum accuracy in the classification of subjects (genotypes) into normal and inverted populations as function of inversion age. The figure shows mean classification accuracy across tB values for all the simulation cases (2250). Our method achieves high accuracy for large inversions and a wide range of frequencies, as simulated by invertFREGENE. We find low accuracy in a discontinuous cluster of older and high frequency inversions, suggesting a critical behavior in the simulations at this point which we discuss further in the main text.

